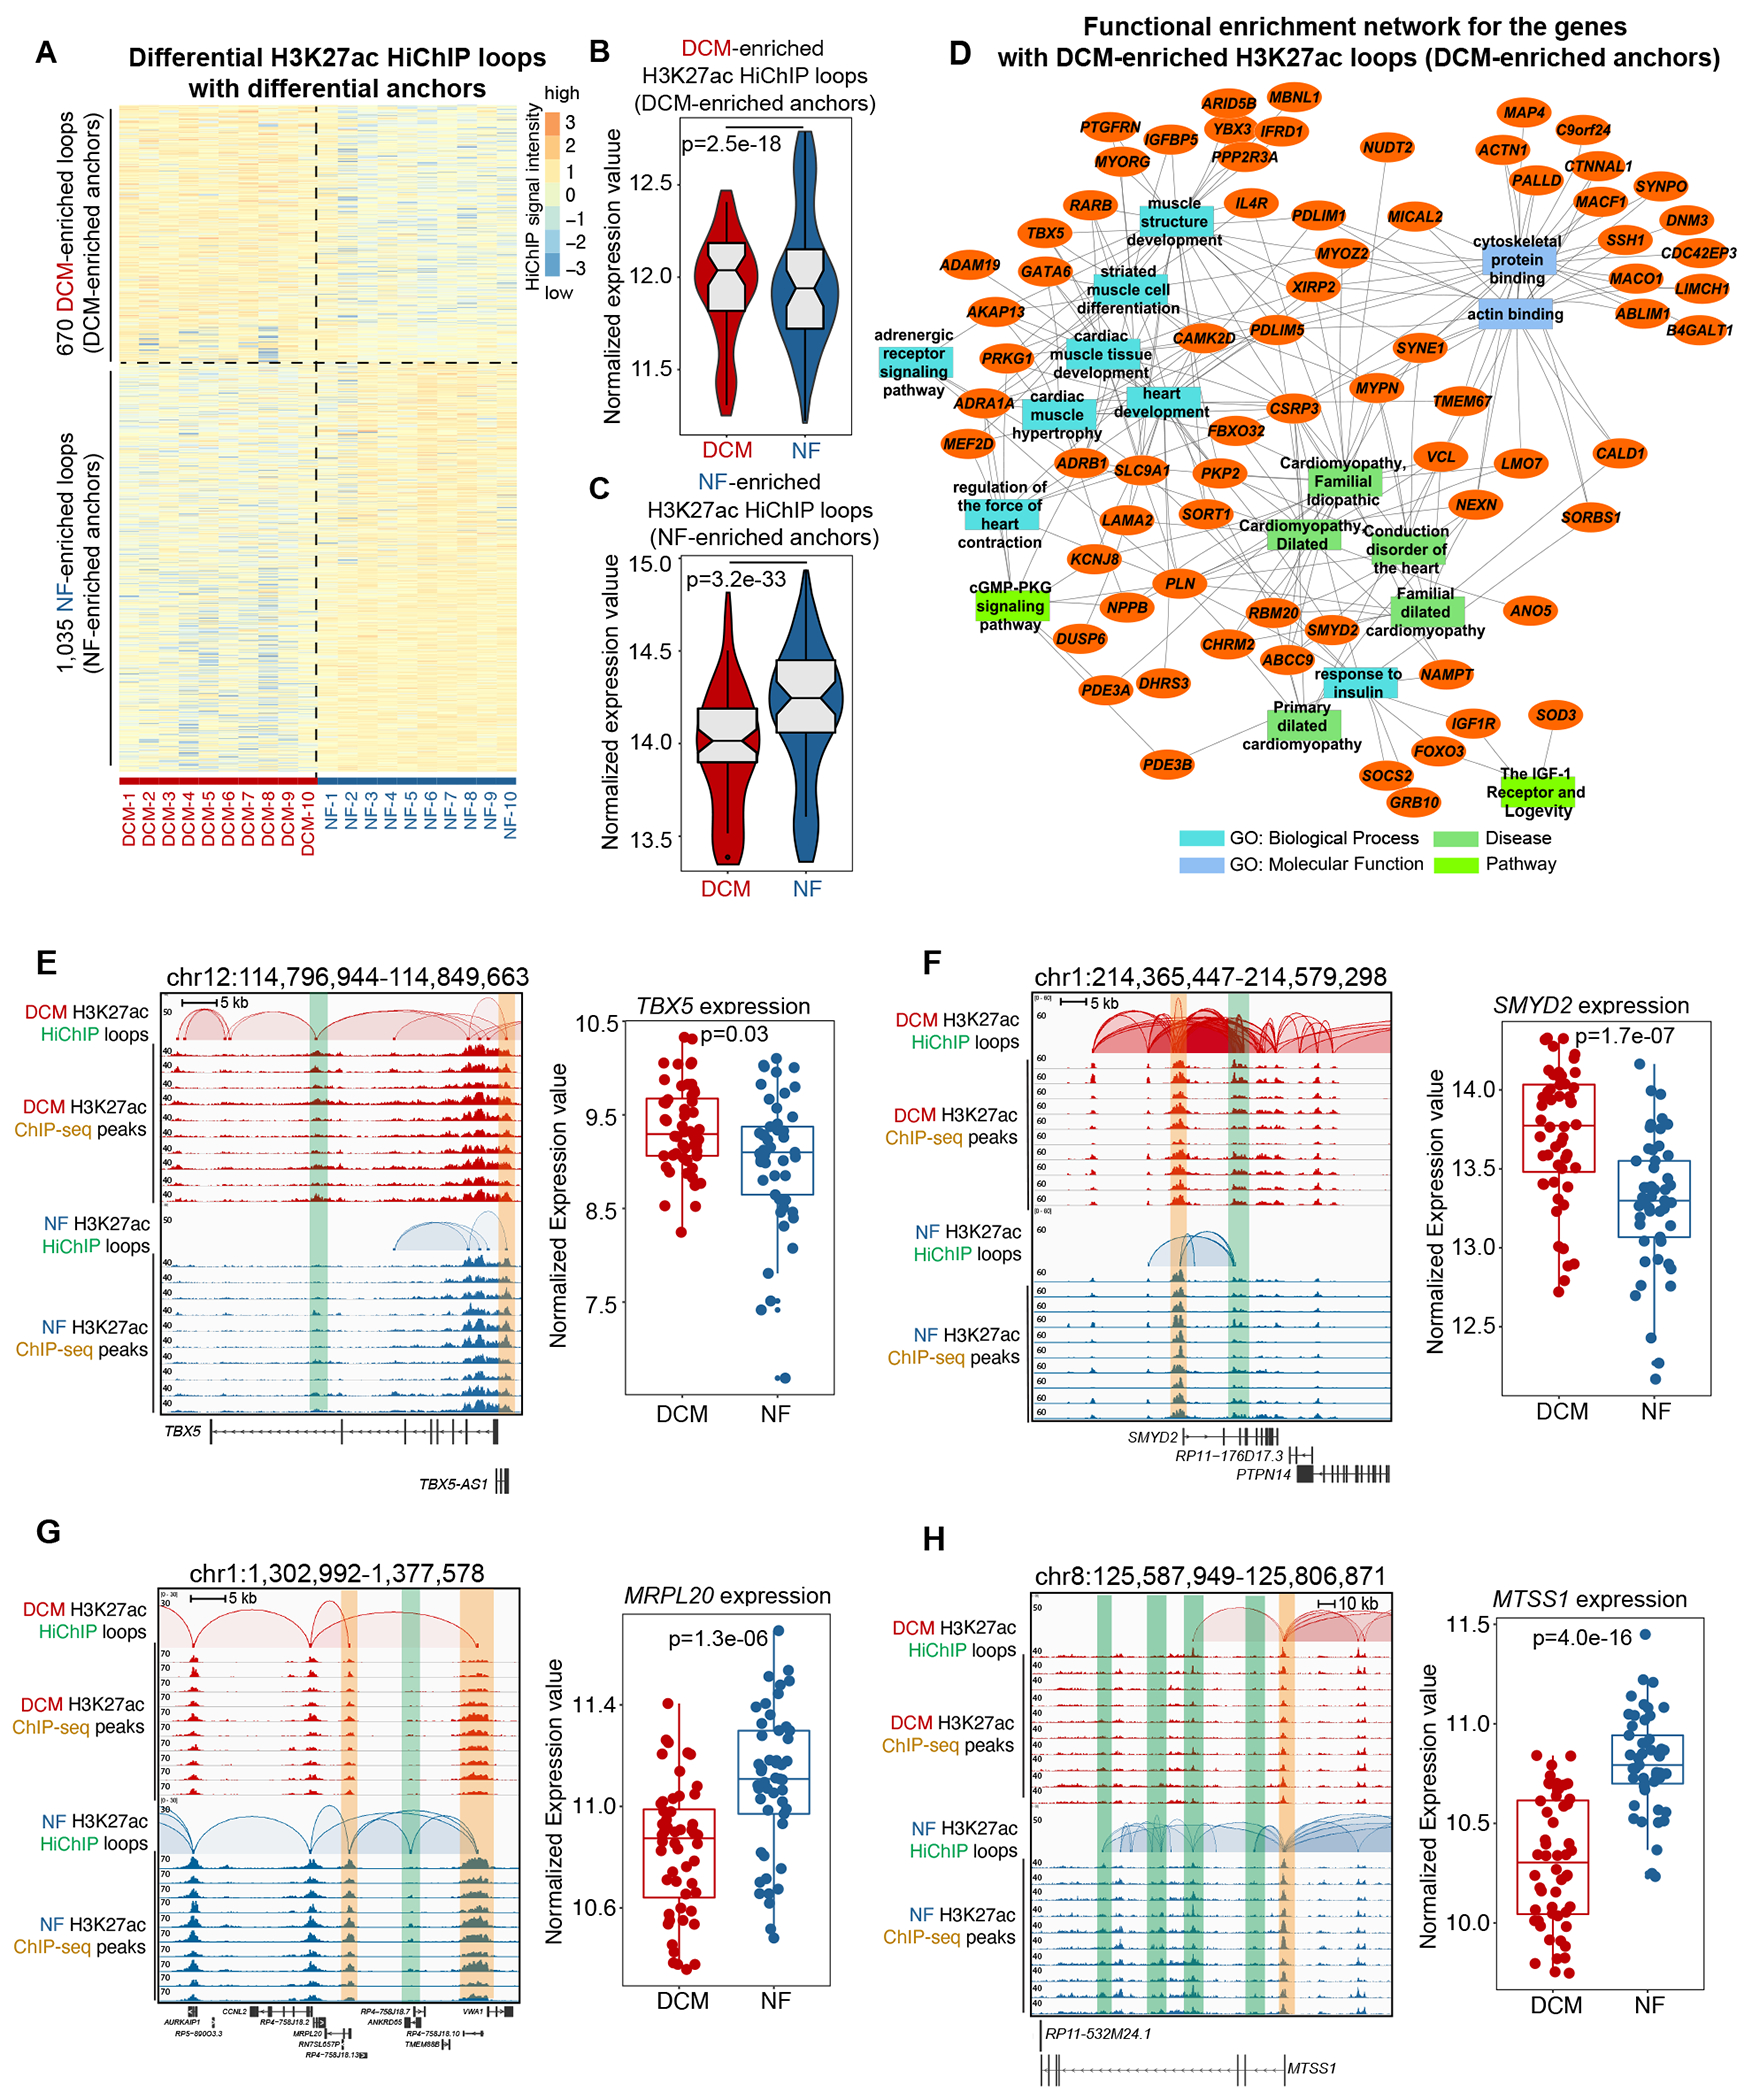
Figure 3. DCM-Enriched Enhancer/Promoter Connectome Contributes to DCM-Specific Transcription.

A. Heatmap showing the intensity of differential H3K27ac loops with differential loop anchors (H3K27ac signal) among 10 DCM and 10 NF heart samples.
B. Normalized expression values of the genes with DCM-enriched H3K27ac loops (DCM-enriched anchors). Data were analyzed by Wilcoxon rank sum test with continuity correction.
C. Normalized expression values of the genes with NF-enriched H3K27ac loops (NF-enriched anchors). Data were analyzed by Wilcoxon rank sum test with continuity correction.
D. Network representation of functional enrichment of the genes with DCM-enriched H3K27ac loops (DCM-enriched anchors). Functional enrichment was done using the ToppFun application. Orange nodes represent DCM-enriched genes, while the different colored rectangles represent enriched terms. Only select enriched terms are shown here. Network was generated using the Cytoscape application.
E. Left panel: browser screenshot showing TBX5 with DCM-enriched E-P interactions (chr12:114,796,944-114,849,663). The top two rows represent the interactions in DCM hearts, and the bottom two rows represent those in NF hearts. The HiChIP loops and ChIP-seq peaks are shown for each. Enhancer is highlighted in the green box, while promoter is highlighted in the orange box; Right panel: expression values (log2(normalized counts)) for TBX5 in 50 DCM and 51 NF heart RNA-seq datasets. Data were analyzed by Wald test.
F. Left panel: browser screenshot showing SMYD2 with DCM-enriched E-P interactions (chr1:214,365,447-214,579,298). The top two rows represent the interactions in DCM hearts, and the bottom two rows represent those in NF hearts. The HiChIP loops and ChIP-seq peaks are shown for each. Enhancer is highlighted in the green box, while promoter is highlighted in the orange box; Right panel: expression values (log2(normalized counts)) for SMYD2 in 50 DCM and 51 NF heart RNA-seq datasets. Data were analyzed by Wald test.
G. Left panel: browser screenshot showing MRPL20 with NF-enriched E-P interactions (chr1:1,302,992-1,377,578). The top two rows represent the interactions in DCM hearts, and the bottom two rows represent those in NF hearts. The HiChIP loops and ChIP-seq peaks are shown for each. Enhancer is highlighted in the green box, while promoter is highlighted in the orange box; Right panel: expression values (log2(normalized counts)) for MRPL20 in 50 DCM and 51 NF heart RNA-seq datasets. Data were analyzed by Wald test.
H. Left panel: browser screenshot showing MTSS1 with NF-enriched E-P interactions (chr8:125,587,949-125,806,871). The top two rows represent the interactions in DCM hearts, and the bottom two rows represent those in NF hearts. The HiChIP loops and ChIP-seq peaks are shown for each. Enhancer is highlighted in the green box, while promoter is highlighted in the orange box; Right panel: expression values (log2(normalized counts)) for MTSS1 in 50 DCM and 51 NF heart RNA-seq datasets. Data were analyzed by Wald test.
