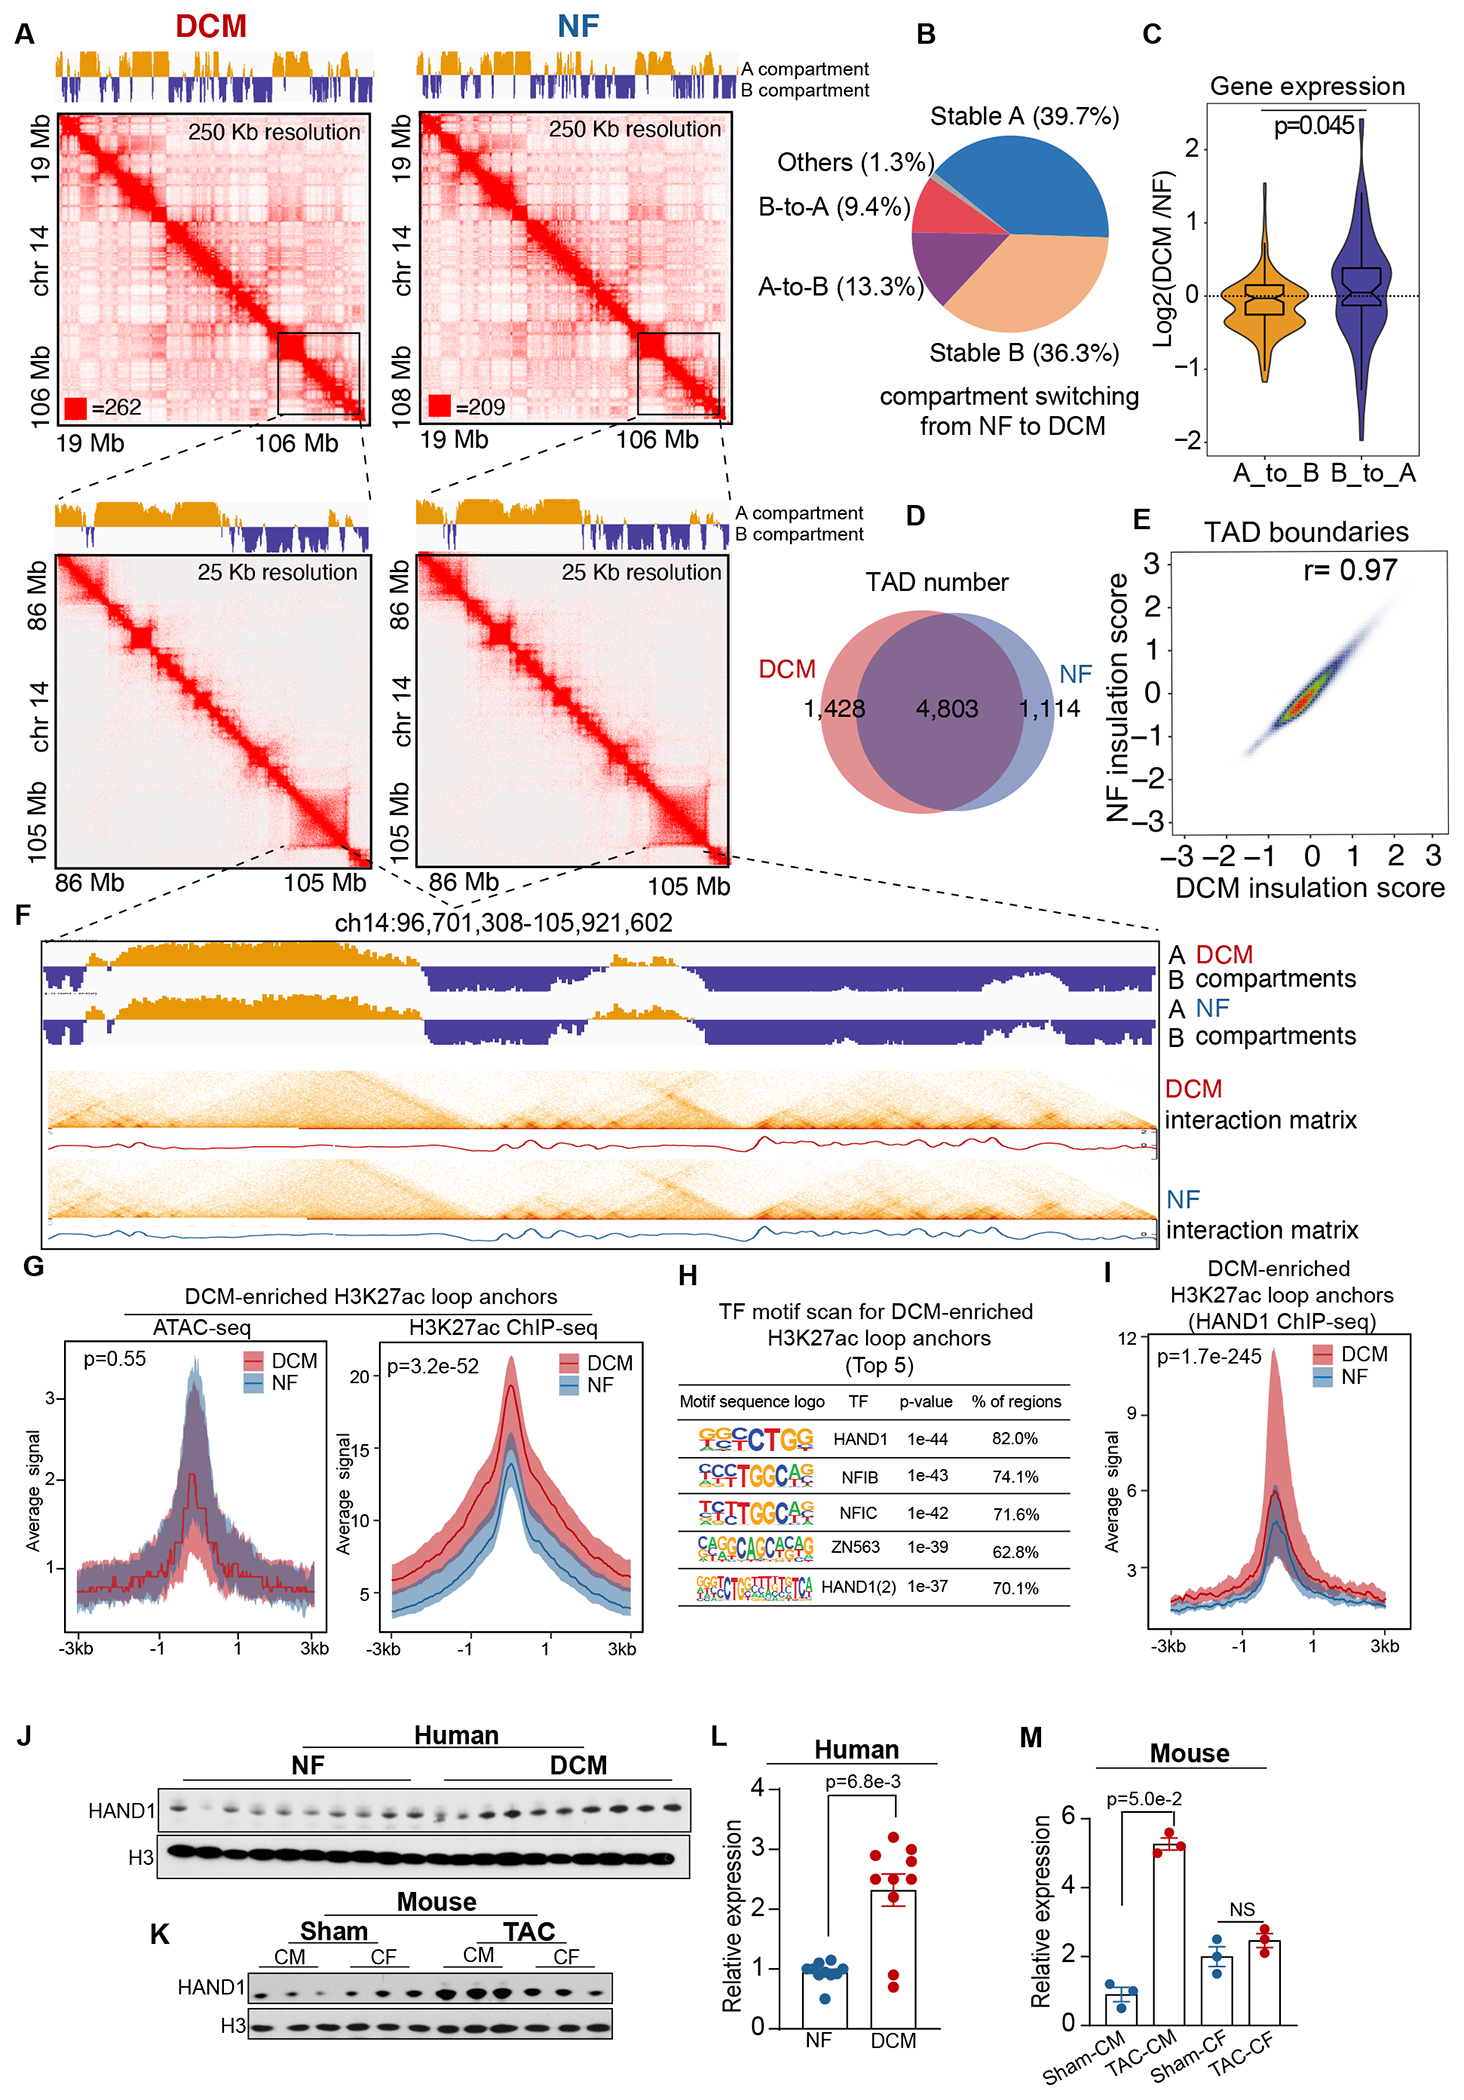
Figure 4. DCM-Enriched Enhancer/Promoter Connectome Largely Resides in Conserved Higher-Order Chromatin Architectures and Pre-accessible Chromatin Sites Bound by Reactivated HAND1.

A. Knight–Ruiz (KR) matrix–balanced interaction maps of merged DCM (top) and NF (bottom) in situ Hi-C valid pairs for DCM and NF hearts at 250 kb and 25 kb resolution. The top tracks indicate the A (yellow) and B (blue) compartments.
B. Proportion of genome switching between the A and B compartments (A-to-B (13.3%), B-to-A (9.4%), stable A (39.7%), and stable B (36.3%)) from NF to DCM hearts.
C. Expression bias in A-to-B and B-to-A compartment-switched genomes in DCM hearts normalized to expression in NF hearts. Data were analyzed by Mann-Whitney U test.
D. Venn diagram showing the number of TADs in DCM hearts (n=1,428) and NF hearts (n=1,114) and in both (n=4,803).
E. Correlation of insulation scores for DCM and NF hearts; the Pearson correlation coefficient (R) is indicated (r=0.97).
F. A/B compartment, Hi-C contact map (heatmap) and corresponding insulation profiles for DCM and NF hearts in the genomic region (ch14:96,701,308-105,921,602).
G. Left panel: aggregation plot of DCM (n=20) and NF (n=20) normalized ATAC-seq signals ± 3 kb centered on the DCM-enriched H3K27ac loop anchors; Right panel: Left panel: aggregation plot of DCM (n=20) and NF (n=20) normalized H3K27ac ChIP-seq signals ± 3 kb centered on the DCM-enriched H3K27ac loop anchors. Data were analyzed by Mann-Whitney U test.
H. Transcription factor motif scan for DCM-enriched loop anchors. The top 5 transcription factors are shown along with their motifs, p-values and percentage of regions.
I. Aggregation plot of normalized HAND1 ChIP-seq signals ± 3 kb centered on the DCM-enriched H3K27ac loop anchors in DCM (n=4) and NF (n=4) hearts. Data were analyzed by Mann-Whitney U test.
J. Evaluation of HAND1 expression (normalized to H3 expression) in human non-failing (NF) hearts and failing hearts (DCM) by Western blot analysis.
K. Evaluation of HAND1 expression (normalized to H3 expression) in mouse cardiomyocytes (CMs) and cardiac fibroblasts (CF) obtained from non-failing hearts (Sham) and failing hearts (8 weeks post-transverse aortic constriction (TAC)) by Western blot analysis.
L. Quantification of HAND1 expression in human NF and DCM hearts. Data were analyzed by Mann-Whitney U test.
M. Quantification of HAND1 expression in mouse CMs and CFs isolated from Sham and TAC hearts. Data were analyzed by Mann-Whitney U test.
