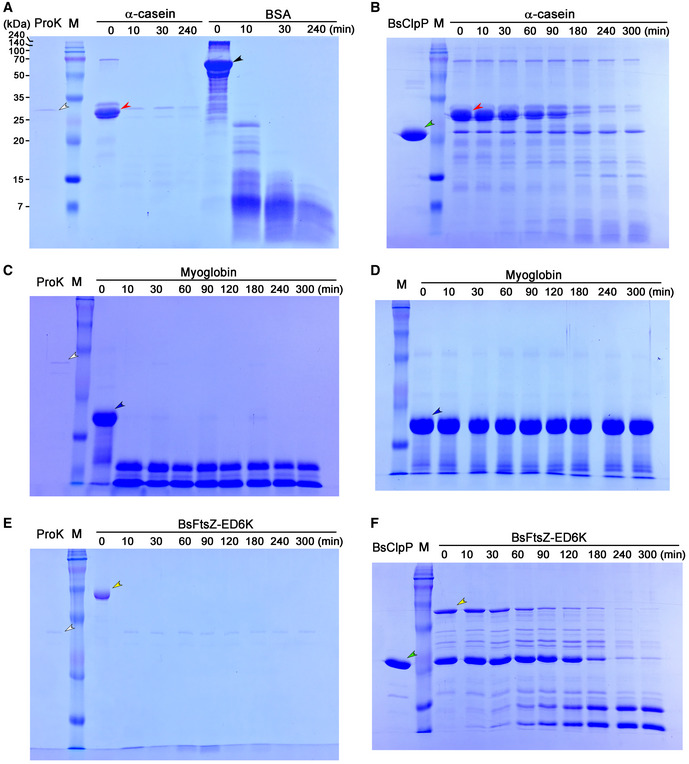
Figure EV2. SDS–PAGE results showing protein hydrolysis in the course of the pH‐drop experiment presented in Fig 1 .

-
ASubstrates α‐casein (red arrowhead) and bovine serum albumin (BSA: black arrowhead) were incubated with proteinase K (ProK: white arrowhead).
-
BSubstrate α‐casein (red arrowhead) was incubated with BsClpP (green arrowhead) in the presence of ADEP1.
-
C, DSubstrate myoglobin (blue arrowhead) was incubated with (C) and without proteinase K (white arrowhead) (D).
-
E, FBasic BsFtsZ‐ED6K substrate (yellow arrowhead) was incubated with proteinase K (white arrowhead) (E) and BsClpP (green arrowhead) + ADEP1 (F).
Data information: In all panels (A–F), the samples were collected at each time point. The “M” lane indicates the molecular weight marker (240, 140, 100, 70, 50, 35, 25, 20, 15, 7 kDa as shown in panel (A)).
