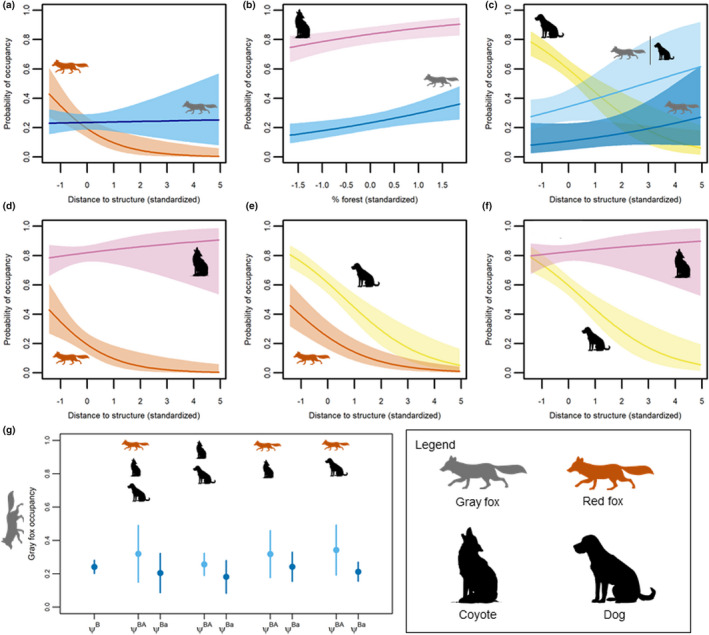
FIGURE 3.

Predicted and estimated canid occupancy in southern Illinois, USA. Predicted occupancy (mean and 95% CI) based on top‐ranked two‐species conditional occupancy models for each pairwise comparison including (a) red fox – gray fox, (b) coyote – gray fox, (c) domestic dog – gray fox, (d) coyote – red fox, (e) dog – red fox, and (f) dog – coyote. Occupancy (y‐axis) is predicted over the landscape covariate with the greatest model selection support for the pairwise candidate set (x‐axis: distance to structure or % forest land cover). Multispecies occupancy model posterior distributions (g; mean and 95% credible intervals) are shown for gray fox occupancy (y‐axis) for all sites (: gray fox occupancy), and when occupancy of other canids was >0.50 (: gray fox occupancy when other canids present) or <0.50 (: gray fox occupancy when other canids absent)
