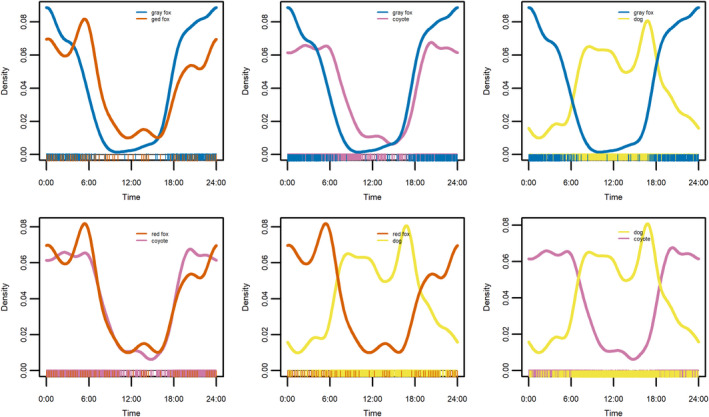
FIGURE 4.

Temporal activity patterns and overlap for pairwise comparisons among canid species (clockwise from top left: red fox – gray fox, coyote – gray fox, domestic dog – gray fox, dog – coyote, dog – red fox, coyote – red fox). Activity is represented by the estimated kernel density (y‐axis) of number of photographic events for each species over a 24‐h period (x‐axis)
