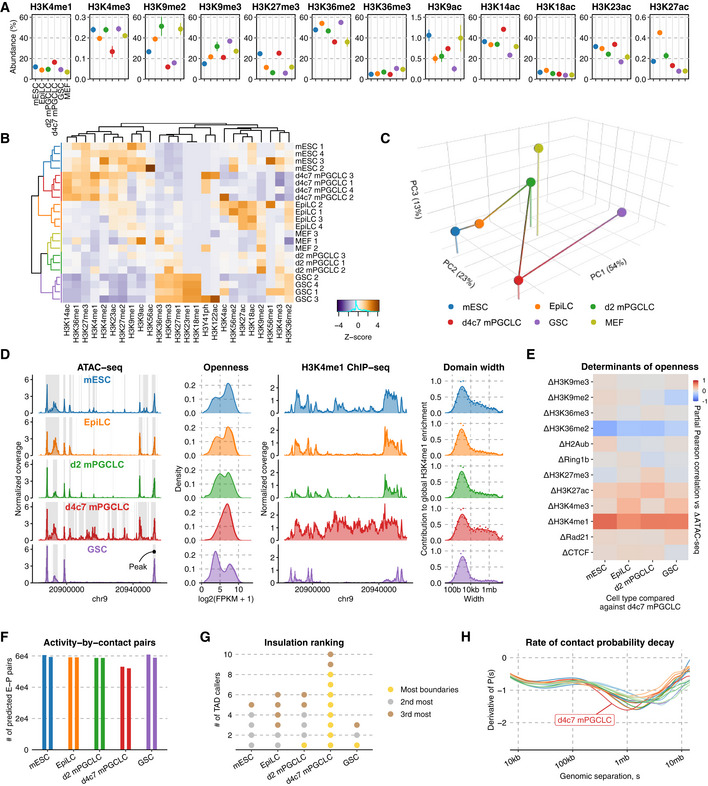
Figure 2. Epigenome profiles and CTCF insulation.

- Relative abundance (%) of key histone modifications as measured by mass spectrometry. The point marks the mean while error bars indicate standard errors. Three biological replicates in each cell type were analyzed.
- UHC of H3 modification abundances. Numeric suffixes indicate biological replicates.
- PCA of average H3 modifications abundances in each cell type.
- Chromatin accessibility landscape throughout germline development. (left) ATAC‐seq coverage tracks at a representative locus, with peaks highlighted; (second left) distribution of read counts per each in the union peak set; (second right) H3K4me1 ChIP‐seq coverage tracks at the same locus; (right) Distribution of domain widths for H3K4me1‐enriched regions based on cross‐correlation, as implemented in MCORE.
- Partial Pearson correlation matrix for inter‐cell type ATAC‐seq differences against d4c7 mPGCLCs versus differences in other epigenetic signals.
- Number of E‐P pairs with ABC score > 0.02 (Fulco et al, 2019). Two biological replicates in each cell type were analyzed.
- Cell type insulation ranking. 10 different TAD‐calling algorithms were used to determine the cell types' rank in terms of insulation (gold: most insulated; silver: 2nd most insulated; bronze: 3rd most insulated).
