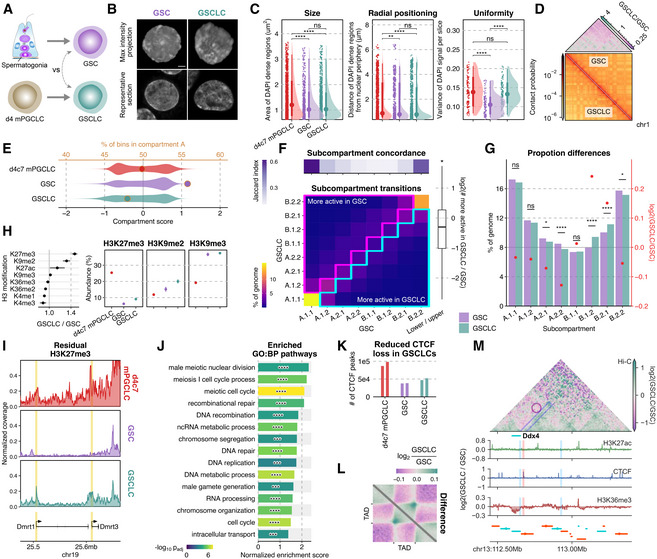
Figure 7. Nucleome differences between GSCs and GSCLCs.

- Scheme for the derivation of GSCs and GSCLCs.
- Maximum intensity projections (top) and representative sections (bottom) of typical nuclei of GSCs and GSCLCs stained with DAPI. Scale bars, 3 μm.
- Areas of DAPI‐dense regions (left), distance of DAPI‐dense regions from the nuclear periphery (middle), and variance of DAPI signals (right). The point marks the median while the thick and thin lines correspond to 66% and 95% intervals, respectively. Number of DAPI dense regions = 1,535/736/1,227 and number of slices = 135/110/120 for d4c7 mPGCLC/GSC/GSCLC. Significances are computed using Wilcoxon rank‐sum tests, P‐values from left to right: 2.03e−10, 1.69e−9, 0.123, 0.00894, 8.02e−8, 0.0707, 7.65e−13, 0.417, 2.07e−12.
- (bottom) 250 kb resolution balanced contact probability matrices of chromosome 1 in GSCs (upper) and GSCLCs (lower); (top) fold change (GSCLCs/GSCs) of contact probability, showing an attenuation of distal interactions in GSCLCs.
- Distribution of compartment scores (bottom axis: violin plots) and the ratio of A:B compartment bins (top axis: dots) at 100 kb resolution.
- Differential subcompartmentalization between GSCs and GSCLCs at 50 kb resolution. (top) Jaccard index between genomic bins belonging to each subcompartment in GSCs vs GSCLCs. (bottom) A comparison of subcompartment labels between cell types reveals a greater proportion of the genome belongs to the upper triangle, in line with GSCLCs being more repressive. (right) Quantification of matched bins in the upper vs lower triangle.
- Comparison of overall subcompartment proportions in GSCs versus GSCLCs. Most significant changes are again observed mostly for the intermediate states and not active euchromatin (A.1) or constitutive heterochromatin (B.2). Significances are computed using two‐proportions z‐tests, p‐values from left to right: 0.0829, 0.107, 0.0169, 3.32e−5, 0.683, 1.09e−16, 7.46e−9, 0.0112.
- (left) Fold change (GSCLCs/GSCs) of different H3 modifications as measured by mass spectrometry, with confidence intervals denoting standard errors; (right) full data for select modifications. Three biological replicates in each cell type were analyzed.
- Normalized H3K27me3 coverage tracks around Dmrt1 and Dmrt3.
- GSEA results for promoters ranked by preferential enrichment in GSCLCs as compared to GSCs. Significances computed using pre‐ranked multilevel GSEA, p‐values from top to bottom: 7.11e−5, 3.31e−6, 5.15e−8, 1.44e−5, 9.71e−5, 3.06e−6, 0.000159, 1.42e−6, 0.000513, 3.66e−7, 0.000185, 8.43e−6, 3.31e−6, 3.7e−7, 0.000194.
- Number of CTCF peaks in each cell type. Two biological replicates in each cell type were analyzed.
- Pile‐up plots of intra‐TAD interactions in GSCs and GSCLCs.
- 3D epigenetic landscape rewiring near Ddx4. Differential (GSCLCs/GSCs) contact maps and ChIP‐seq coverage at the Ddx4 locus are shown. The insulating CTCF peak separating Ddx4 from one of its enhancers is not completely removed in GSCLCs.
Data information: P‐value symbol brackets: **** = [0, 0.0001); ** = [0.001, 0.01); * = [0.01, 0.05); ns = [0.05, 1].
