
Fig. 1.
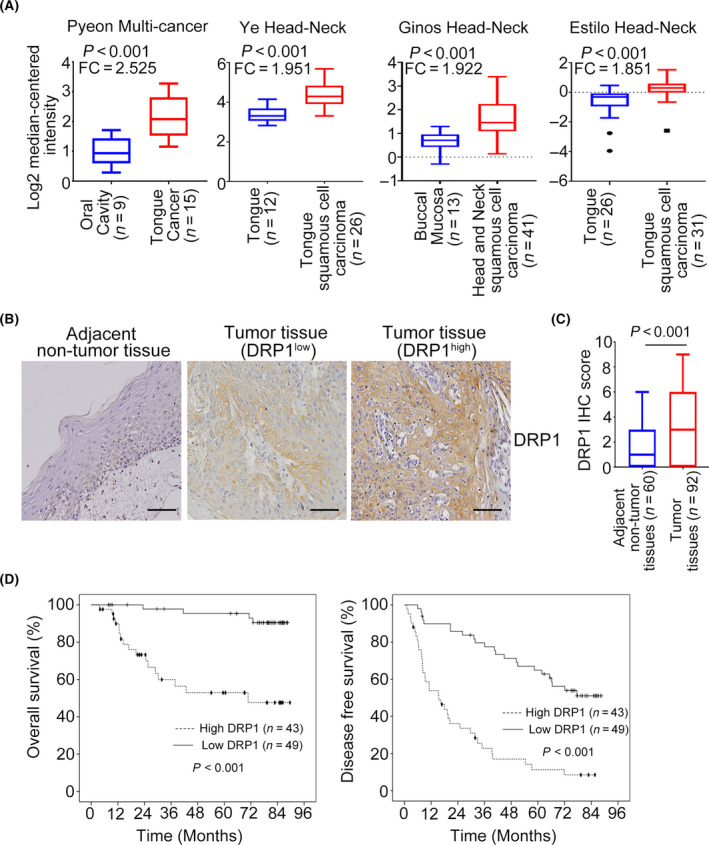
DRP1 expression is upregulated in HNC and is associated with poor outcomes. (A) The DRP1 mRNA expression in HNC samples from Oncomine datasets. Data are presented as mean ± SD. Significance is calculated using t‐test. (B) Representative images of immunohistochemical staining for DRP1 in adjacent nontumor tissues and tumor tissues of HNC. Scale bar: 100 µm. (C) Average staining scores for DRP1 expression in HNC tumor tissues and adjacent nontumor tissues. Data are presented as mean ± SD. Significance is calculated using unpaired t‐test. (D) DRP1 expression in overall and disease‐free survival was assessed in patients with HNC using Kaplan–Meier analyses. P‐values were determined using the log‐rank test.