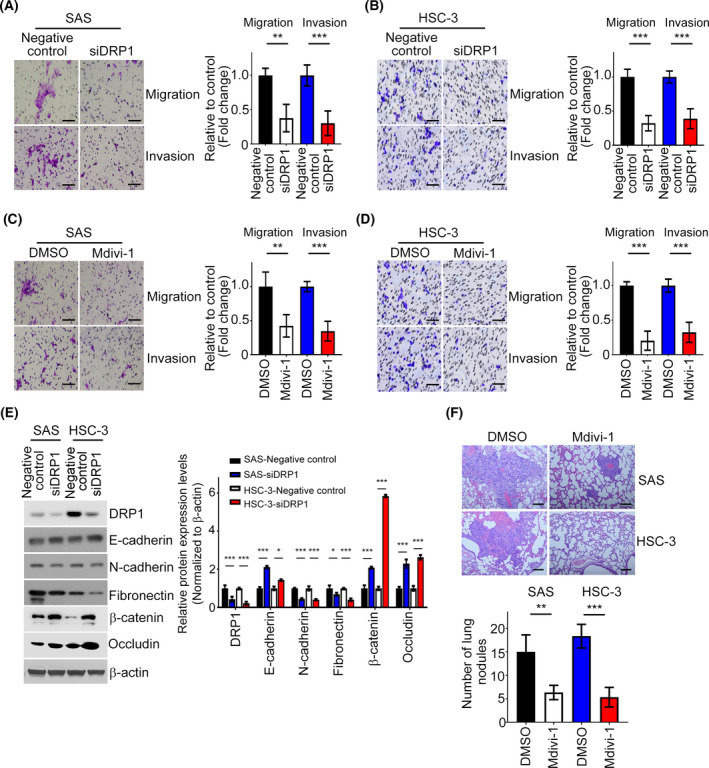
Fig. 3.

DRP1 depletion restrains cell metastasis in HNC. (A, B) The Transwell assay was performed to examine the effect of DRP1 on cell migration and invasion in SAS and HSC‐3 cells. The representative images and the fold changes of cell migration and invasion are presented. Scale bar: 100 µm. (C, D) Migration and invasion assays of SAS and HSC‐3 cells treated with Mdivi‐1. The representative images and the fold changes of cell migration and invasion are presented. Scale bar: 100 µm. (E) DRP1, E‐cadherin, N‐cadherin, fibronectin, β‐catenin and Occludin protein expressions were determined in SAS/negative control, SAS/ siDRP1, HSC‐3/negative control, and HSC‐3/ siDRP1 by western blotting. (F) HE staining was performed to demonstrate the tumor nodule in the lungs; n = 4 per group. Representative images and statistical analyses are shown. Scale bar: 50 µm. All data are presented as mean ± SD of three independent experiments. Significance was calculated using t‐test. ** P < 0.01, *** P < 0.001.
