
Fig. 4.
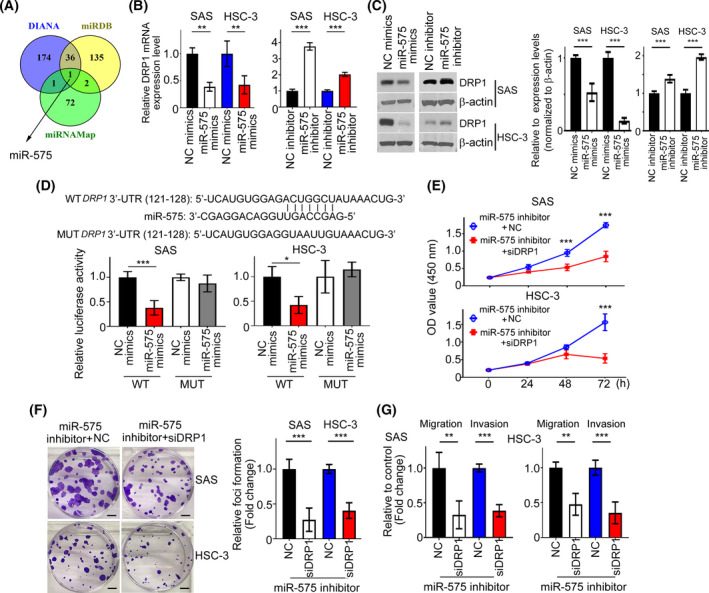
DRP1 targeted by miR‐575. (A) A drawn Venn diagram was used to identify miRNA among three cohort profile datasets. (B) The mRNA expression profiles of DRP1 were determined by QPCR in SAS and HSC‐3 cells transfected with miR‐575 mimics or inhibitors. (C) SAS and HSC‐3 cells were transfected with miR‐575 mimics or inhibitor for 36 h. DRP1 protein was investigated by western blotting. Quantification of relative DRP1 expression was shown. (D) Luciferase reporter assays were performed to demonstrate the influence of miR‐575 on the activity of DRP1 mRNA 3’UTR. (E– G) Cells expressing miR‐575 inhibitor were transfected with siDRP1 or NC for 24 h. Cell proliferation, migration and invasion were examined by MTT, colony formation and Transwell assays. NC, negative control. Scale bar: 500 µm. All data are presented as mean ± SD of three independent experiments. Significance was calculated using t‐test. In (E), statistical analyses were performed using one‐way ANOVA followed by Tukey’s multiple comparison’s test. * P < 0.05, ** P < 0.01, *** P < 0.001.