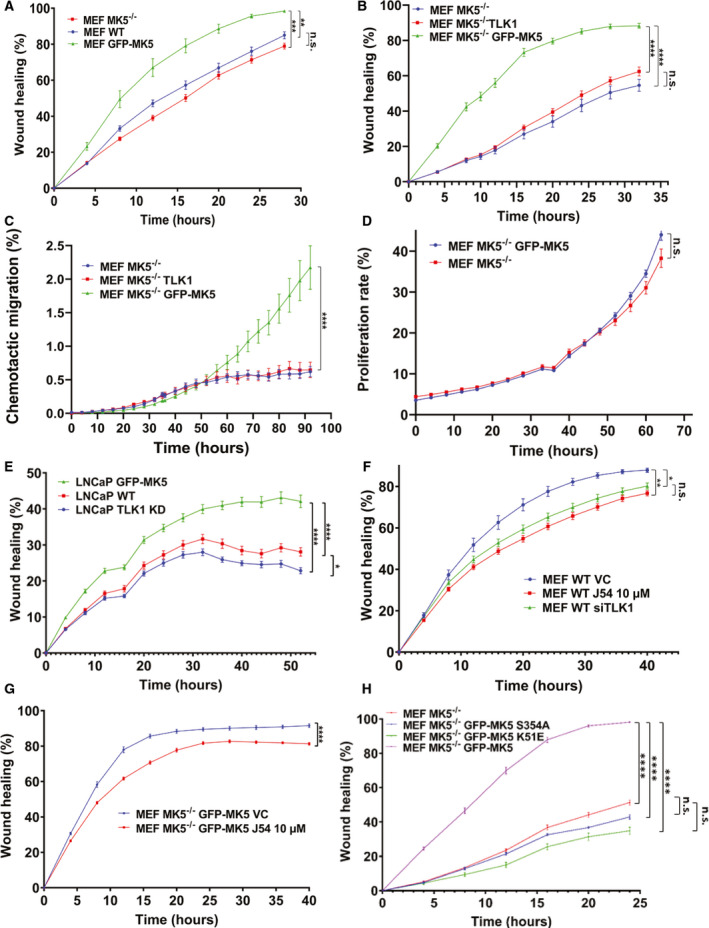
Fig. 1.

Both MK5 and TLK1 regulate cell migration. A, B, E, F, G and H) Scratch wound repair assay was conducted to determine the 2D migration rate by plotting relative wound density against different time points. (A) Wild‐type MEF (MEF WT), mean rate (MR): 10.97 ± 0.45; MEF MK5−/−, MR: 9.40 ± 0.35; and MEF GFP‐MK5, MR: 15.32 ± 1.2. (B) MEF MK5−/−, MR: 4.23 ± 0.30; MEF MK5−/− TLK1, MR: 5.19 ± 0.22; and MEF MK5−/− GFP‐MK5, MR: 13.69 ± 0.57. (E) LNCaP WT, MR:3.97 ± 0.10; LNCaP TLK1 kinase dead (KD), MR:3.47 ± 0.11; and LNCaP GFP‐MK5, MR: 5.10 ± 0.16. (F) MEF wild‐type vehicle control (MEF WT VC, MR: 12.18 ± 0.71); MEF WT J54 10 µm, MR: 9.65 ± 0.30; and MEF WT siTLK1, MR: 10.51 ± 0.37. (G) MEF MK5−/− GFP‐MK5 VC, MR: 17.40 ± 0.40; MEF MK5−/− GFP‐MK5 J54 10 µm, MR: 14.39 ± 0.22. (H) MEF MK5−/−, MR: 5.62 ± 0.12; MEF MK5−/− GFP‐MK5‐S354A, MR: 5.79 ± 0.55; MEF MK5−/− GFP‐MK5 K51E, MR: 4.96 ± 0.31; and MEF MK5−/− GFP‐MK5, MR: 15.63 ± 0.22. (C) 3D chemotactic trans‐well migration assay among MEF MK5−/−, MEF MK5−/− TLK1 and MEF MK5−/− GFP‐MK5 cells at different time points using fibronectin coating. Migration rate was determined by plotting total object phase area against time among MEF MK5−/−, MR: 0.04 ± 0.005; MEF MK5−/− TLK1, MR: 0.07 ± 0.014; and MEF MK5−/− GFP‐MK5, MR: 0.16 ± 0.009. (D) Proliferation assay between MEF MK5−/− and MEF MK5−/− GFP‐MK5 cells by plotting confluence percentage over time. MEF MK5−/−, MR: 1.93 ± 0.08; MEF MK5−/− GFP‐MK5, MR: 1.97 ± 0.006. 2‐tailed Student’s t‐test was used for two group comparison, and one‐way ANOVA followed by Tukey’s post hoc analysis was used for multiple group comparison. *=P < 0.05, **=P < 0.005, ***=P < 0.0005, ****=P < 0.0001 and n.s. = not significant. Each data point contains 8‐12 replicates. Error bar represents standard error of the mean (SEM).
