Fig. 2.

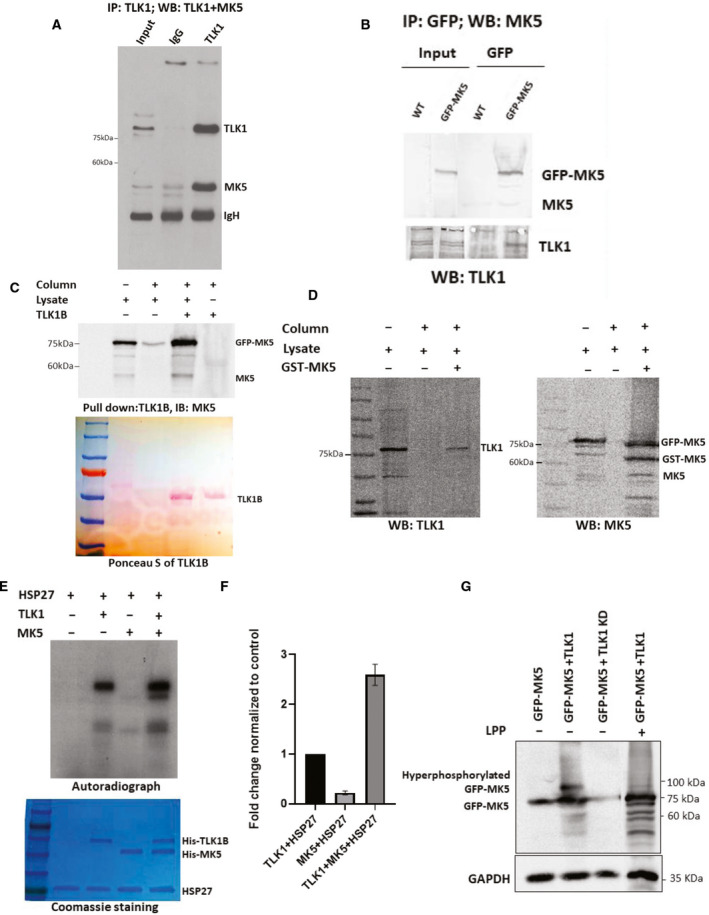
TLK1 interacts and phosphorylates MK5 both in vitro and in cultured cells. (A) Co‐immunoprecipitation of endogenously expressed MK5 with TLK1 antiserum from LNCaP cells and blotted sequentially for TLK1 and MK5. (B) GFP‐MK5 was overexpressed in HEK 293 cells. MK5 was immunoprecipitated using GFP‐specific antibody and blotted for both MK5 (upper panel) and TLK1 (lower panel). (C) His pulldown assay using purified his‐tagged TLK1B incubated with GFP‐MK5‐overexpressing HEK 293 cell lysate. Upper panel, WB showing both GFP‐MK5 and endogenous MK5 level. Lower panel, Ponceau S image showing TLK1B band. (D) GST pulldown assay using purified GST‐tagged MK5 incubated with GFP‐MK5 and TLK1 co‐expressing HEK 293 cell lysates. Left panel, WB detection of TLK1. Right panel, WB detection of both GFP‐MK5 and GST‐MK5. (E) An in vitro kinase (IVK) assay using recombinant his‐tagged HSP27 incubated with either his‐tagged TLK1B or his‐tagged MK5 or altogether. [ɣ‐32P] ATP was used as a radioactive source. Top panel, an autoradiograph showing the intensity of the exposed bands of the corresponding protein. Bottom panel, Coomassie‐stained gel showing equal amount of protein loading. (F) Relative densitometry of the fold change of HSP27 phosphorylation. One‐way ANOVA followed by Tukey’s post hoc analysis was used. Error bar represents standard error of the mean (SEM). (G) HEK 293 cells transfected with either GFP‐MK5 alone, or GFP‐MK5+TLK1, or GFP‐MK5+TLK1 KD. Lambda protein phosphatase (LPP) treatment was done in the 4th lane. WB showing hyperphosphorylated GFP‐MK5 band in the 2nd lane, which is reduced by LPP treatment (4th lane). GAPDH was used as a loading control. Each figure is representative of n = 3 experiments.
