
Fig. 1.
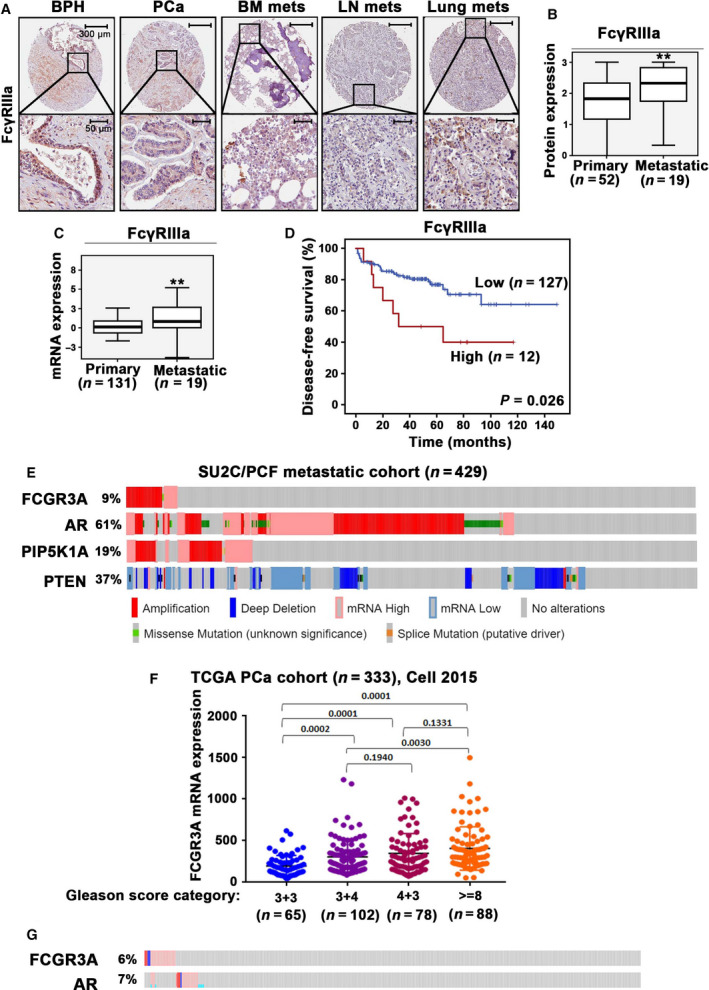
Evaluation of FcγRIIIa expression in primary tumors and metastatic lesions from PCa patients and the association between FcγRIIIa expression and patient outcome. (A) Representative microphotographs of benign prostate hyperplasia (BPH) (n = 48), PCa specimens (PCa) (n = 52) and metastatic lesions in bone marrow (BM mets), lymph node (LN mets), and lung (Lung mets) from PCa patients (n = 19), as assessed by immunohistochemical analysis of TMAs using antibody against FcγRIIIa. The scale bars: 300 µm and 50 µm are indicated and apply to all images in the panel. (B) Box‐plot quantitative comparison of FcγRIIIa protein expression between primary PCa, n = 52 and metastatic PCa, n = 19 (mean scores in primary and metastatic lesions were 1.73 and 2.17, difference = 0.74; 95% CI = 1.81–2.27, P = 0.006). **P < 0.01 is indicated. The error bars indicate SD. The student t‐test was used to determine the significance. (C) Box‐plot quantitative comparison of FCGR3A mRNA expression between primary (n = 131) and metastatic lesions (n = 19) (P < 0.01), **P < 0.01 is indicated. The error bars indicate SD. The student t‐test was used to determine the significance. (D). Kaplan–Meier survival analysis based on biochemical recurrence‐free (BCR‐free) survival shows the difference between patients with low and high expression of FCGR3A. Differences in BCR‐free survival between two groups and P‐values were calculated using the log‐rank test. P = 0.026 is indicated. (E). Alterations in genes and mRNA expression of FCGR3A, AR and PIP5K1A and PTEN in metastatic PCa cohort SU2C/PCF (n = 429) are shown in onco‐prints. Different types of alterations in genes and their respective mRNA expression are indicated. (F). Dot plot graph shows the FCGR3A mRNA expression in four subgroups of PCa that were categorized using Gleason scores (TCGA PCa cohort, n = 333). Subgroups with Gleason score 3 + 3 (n = 65), Gleason score 3 + 4 (n = 102), Gleason score 4 + 3 (n = 78), and Gleason score >=8 (n = 88). The expression of FCGR3A mRNA in comparison between group of Gleason score >=8 and Gleason score 3 + 4, P = 0.003; the expression of FCGR3A in comparison between group of Gleason score 4 + 3 and Gleason score 3 + 3, P < 0.001. The ANOVA test was used to determine the significance. (G). Alterations in genes and mRNA expression of FCGR3A and AR in the PCa cohort mentioned in (F) are shown in onco‐prints.