
Fig. 3.
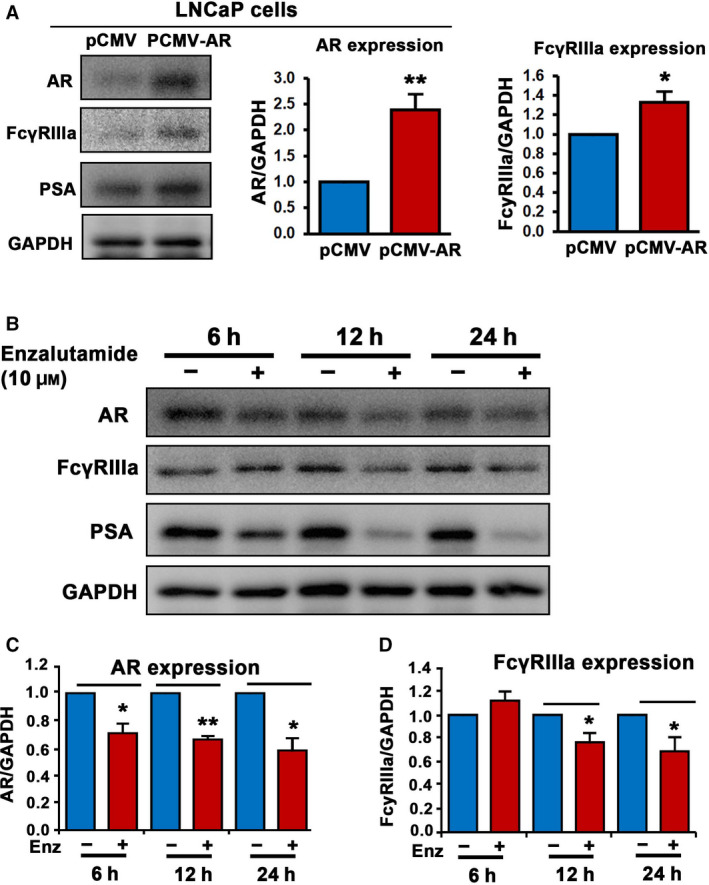
The association between AR and FcγRIIIa in LNCaP cells. (A) The effect of elevated level of AR expression on FcγRIIIa and PSA protein expression in LNaCp cells was assessed using immunoblot analysis. The quantifications of the immunoblots for AR and FcγRIIIa are shown in the right panels. Expression of AR and FcγRIIIa was significantly higher in LNCaP cells transfected with PCMV‐AR vector than that of control pCMV vector, for AR, P = 0.003, for FcγRIIIa, P = 0.03. Data are presented as average of three independent experiments (n = 3), **P < 0.01 and *P < 0.05 are indicated. The error bars indicate SEM. The student t‐test was used to determine the significance. (B) The effect of inhibition of AR using enzalutamide on FcγRIIIa expression in LNCaP cells was assessed using immunoblot analysis. Data are representative of two independent experiments (n = 2) with each experiment performed in duplicates (n = 2). (C and D) The quantifications of the immunoblots for AR and FcγRIIIa are shown. Data are presented as average of two independent experiments (n = 2) with each experiment performed in duplicates (n = 2), P < 0.05, as indicated by ‘*’. P < 0.01 is indicated by ‘**’. Expression of AR and FcγRIIIa was significantly decreased in LNCaP cells treated with enzalutamide for 12 h and 24 h, respectively, as compared with that of vehicle control‐treated cells (for AR, enzalutamide treatment vs. control treatment for 6 h, P = 0.026; 12 h, P = 0.003; and 24 h, P = 0.021; for FcγRIIIa, enzalutamide treatment vs. control treatment for 6 h, P = 0.325; 12 h, P = 0.03; and 24 h, P = 0.034.). The error bars indicate SEM. The student t‐test was used to determine the significance.