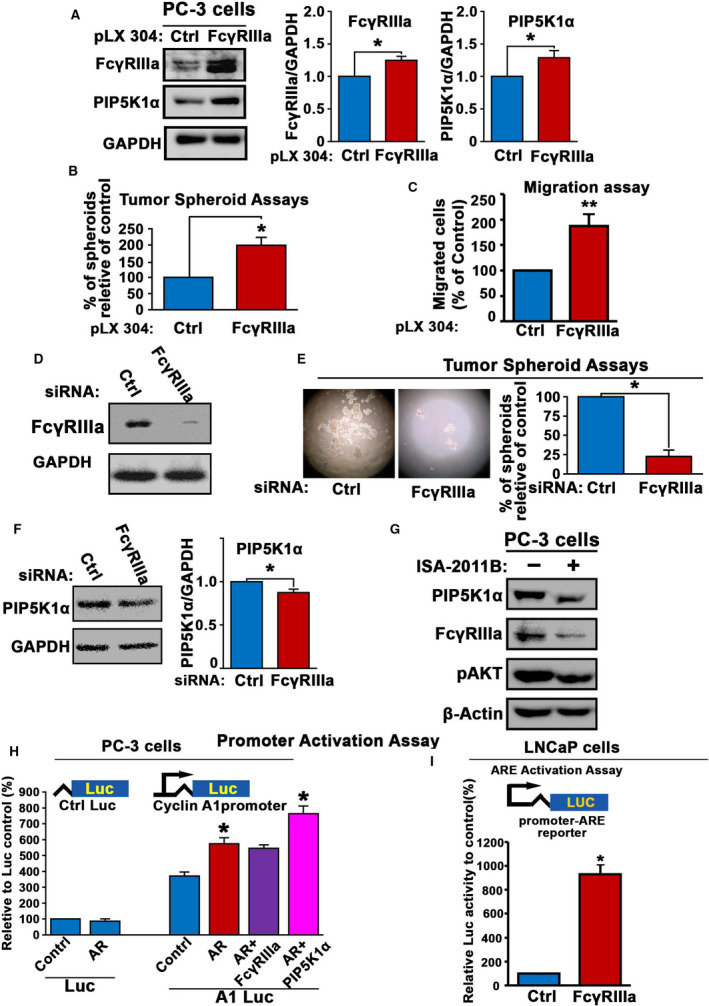
Fig. 4.

The role of FcγRIIIa in promoting tumorigenesis and its association with AR and PIP5K1α in PC‐3 cells. (A) The effect of induced overexpression of FcγRIIIa on expression of PIP5K1α in PC‐3 was assessed by immunoblot analysis. The quantifications of the immunoblots are shown in the right panels. Expression of FcγRIIIa and PIP5K1α was significantly higher in PC‐3 cells transfected with FcγRIIIa than that of control vector, for PIP5K1α, P = 0.011. Data are representative of three independent experiments (n = 3), P < 0.05, as indicated by ‘*’. The error bars indicate SEM. The student t‐test was used to determine the significance. (B) The effect of FcγRIIIa overexpression on the tumorigenic ability of PC‐3 cells was assessed using tumor‐spheroid formation assays. Data shown are representative of two independent experiments (n = 2) with each experiment performed in triplicates (n = 3), P < 0.05, as indicated by ‘*’. The error bars indicate SEM. The student t‐test was used to determine the significance. (C) The effect of induced overexpression of FcγRIIIa on migratory ability of PC‐3 cells was assessed by using migration assay. Data shown are presented as average of three independent experiments (n = 3), P < 0.01, as indicated by ‘**’. The error bars indicate SEM. The student t‐test was used to determine the significance. (D) The depletion of FcγRIIIα in PC‐3 cells transfected with siFcγRIIIa RNA (FcγRIIIa) compared with PC‐3 cells transfected with siRNA scramble control (Ctrl) was assessed by using immunoblot analysis. Data are representative of two independent experiments (n = 2) with each experiment performed in duplicates (n = 2). (E) The effect of FcγRIIIa knockdown on tumorigenic ability of PC‐3 cells was determined using tumor‐spheroid formation assays. Representative images of tumor spheroids are shown. The spheroid counts are shown in the right panel. Mean tumor‐spheroid counts in si‐control and si‐FcγRIIIa PC‐3 cells were 56 and 14, difference = 42, 95% CI in si‐control = 43‐68 and si‐FcγRIIIa = 6‐21, P = 0.012. Data are representative of two independent experiments (n = 2), and each experiment was performed in triplicates (n = 3), P < 0.05, as indicated by ‘*’. The error bars indicate SEM. The student t‐test was used to determine the significance. (F) The effect of FcγRIIIa knockdown on PIP5K1α in PC‐3 cells was determined using immunoblot analysis. Data shown in the right panel are representative of three independent experiments (n = 3), P < 0.05, as indicated by ‘*’. The error bars indicate SEM. The student t‐test was used to determine the significance. (G) The effect of inhibition of PIP5K1α by its inhibitor ISA‐2011B on IP5K1α, FcγRIIIa, and pAKT in PC‐3 cells was determined using immunoblot analysis. Data are representative of at least three independent experiments (n = 3). (H) Effect of induced AR alone or together with induced FcγRIIIa or PIP5K1α expression on the activity of full‐length cyclin A1 promoter was assessed using luciferase assay. The vectors were induced together with luc‐reporter vector ‘Luc’ or cyclin A1 promoter‐luc‐reporter vector ‘A1‐Luc’ into PC‐3 cells (For AR alone, P = 0.003, for AR+PIP5K1α, P = 0.008). Data are representative of at least two independent experiments (n = 2), and each experiment was performed in triplicates (n = 3). The error bars indicate SEM. The student t‐test was used to determine the significance. (I) Effect of FcγRIIIa overexpression on androgen‐responsive (ARE) promoter activity in LNCaP cells was carried out using the dual‐luciferase assays. FcγRIIIa overexpression‐induced ARE reporter luciferase activity led to an increase by 100% relative to controls in LNCaP cells, P = 0.013. Data shown are presented as average of two independent experiments (n = 2), and each experiment was performed in triplicates, P < 0.05, as indicated by ‘*’. The error bars indicate SEM. The student t‐test was used to determine the significance.
