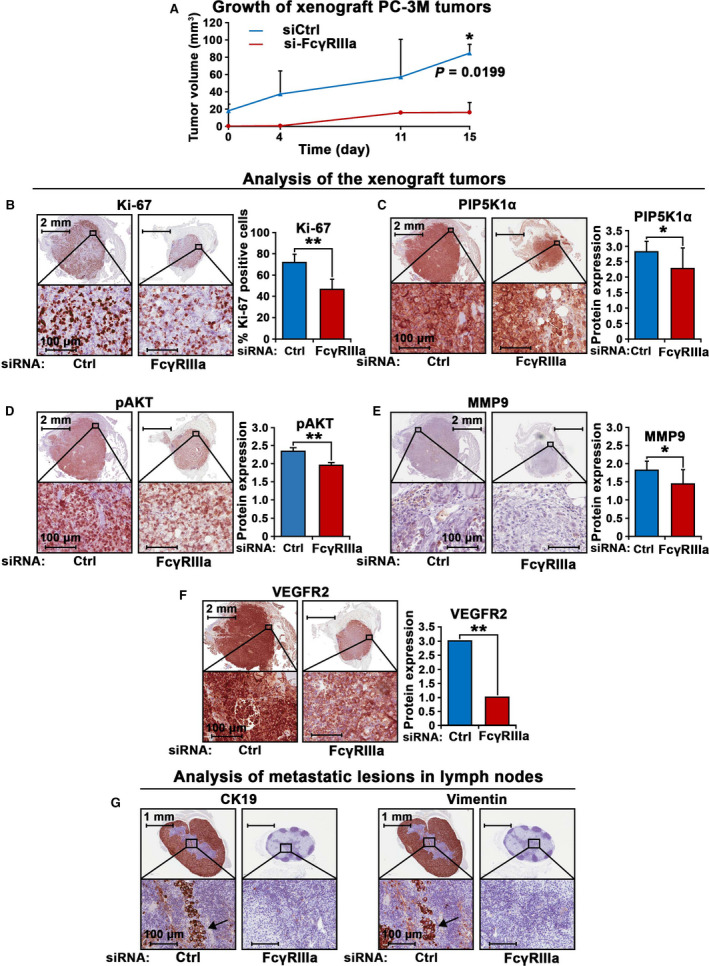
Fig. 5.

The inhibitory effect of FcγRIIIa knockdown on growth of tumors in xenograft mouse model. (A) Growth curves of PC‐3 M tumors expressing si‐control RNA (siCtrl) or si‐ FcγRIIIa (FcγRIIIa) in xenograft mice are shown (n = 4 per group). Tumor volumes are indicated in Y‐axis, and the measurement days are indicated in x‐axis. Tumors from each group were collected at the end of the experiment. (B, C, D, E, F) Expression of the key proteins for proliferation and invasion in the xenograft tumors collected from the mice was assessed by using immunohistochemical analysis. Representative images of the siCtrl tumors and si‐FcγRIIIa tumors that were stained with antibodies against Ki‐67, PIP5K1α, pAKT, MMP9, and VEGFR2 are shown. Quantification of the staining intensity of the proteins is shown in the right panels. Mean Ki‐67‐positive cells in siCtrl and siFCGR3A tumors were 71.82% and 46.67%, difference = 25.15%; 95% CI = 38.40 to 54.93%, P < 0.001. Mean PIP5K1α expression in si‐control and si‐FcγRIIIa tumors was 2.82 and 2.20, difference = 0.54, 95% CI for si‐control = 2,78–2,85, si‐FcγRIIIa = 2.13‐2.43. P = 0.048; mean pAKT expression for si‐control and si‐FcγRIIIa were 2.34 and 1.96, difference = 0.39, 95% CI for si‐control = 2.3–2.38, and for si‐FcγRIIIa = 1.94–1.98, P = 0.0045. Mean MMP9 expression in si‐control and si‐FcγRIIIa was 1.82 and 1.44, difference=0.37, 95% CI in si‐control = 1.8‐1.84, and in si‐FcγRIIIa = 1.39‐1.5, P = 0.028. **P < 0.01 and *P < 0.05 are indicated. Tumors from the two groups (for si‐control group, n = 3; for si‐FcγRIIIa group, n = 2) were stained with the indicated antibodies and were evaluated. The error bars indicate SEM. The student t‐test was used to determine the significance. The scale bars: 2 mm and 100 µm in the images in B, C, D, E, and F are indicated. (G) Representative images of the lymph nodes containing metastatic lesions from the xenograft mice bearing si‐FcγRIIIa tumors as compared with that of si‐control RNA (siCtrl) are shown. Tumors were immune‐stained with the antibodies against CD19 and Vimentin that are markers for cancer cells. Tumor cells positive to the markers were indicated by the arrows. Tumors from the two groups (for si‐control group, n = 3; for si‐FcγRIIIa group, n = 2) were stained with the indicated antibodies and were evaluated. The scale bars: 1 mm and 100 µm are indicated.
