Fig. 6.

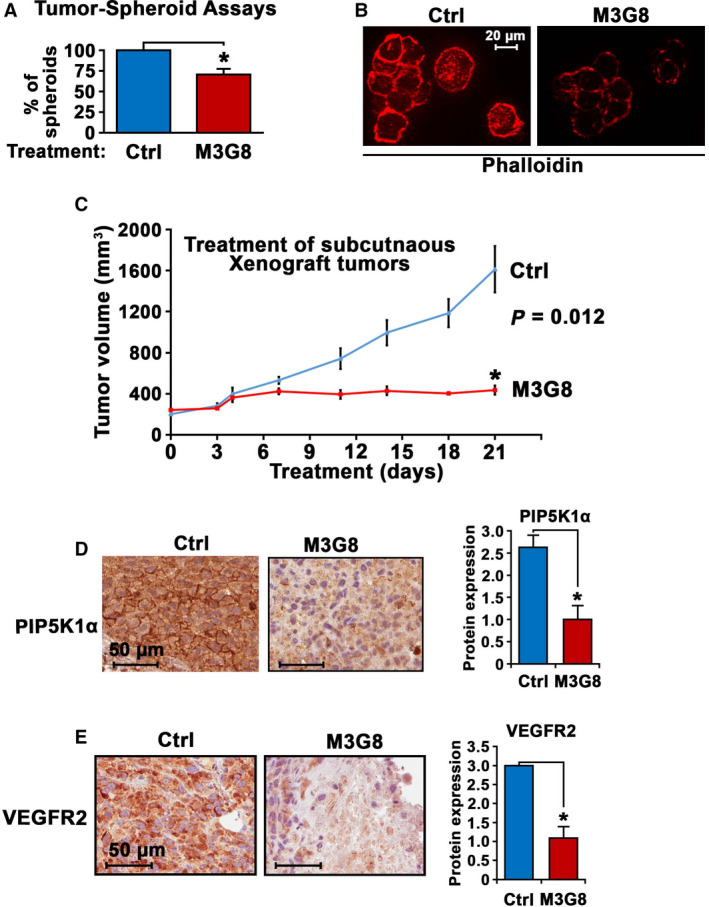
The interlink between PIP5K1α and FcγRIIIa and inhibition of via monocloncal antibody M3G8 in PCa cells. (A) The effect of M3G8 on growth of tumor spheroids derived from PC‐3 cells cocultured with U‐937 cells. Tumor spheroids were treated with control or M3G8 antibodies. Mean tumor‐spheroid counts in control antibody‐treated and in M3G8‐treated groups = 38‐26, difference = 12, 95%CI = 22–31, P = 0.028. Data are representative of two independent experiments (n = 2), and each experiment was performed in triplicates, P < 0.05, as indicated by ‘*’. The error bars indicate SEM. The student t‐test was used to determine the significance. (B) Representative immunofluorescent images from (A) showing the tumor spheroids treated with M3G8 or control antibodies that are highlighted with phalloidin staining (red). The experiments were replicated (n = 2). The scale bar: 20 µm is indicated. (C) Growth of PC‐3 subcutaneous xenograft tumors that were treated with control IgG antibody (Ctrl) or M3G8 antibody. Treatment started on day 0 when the mean tumor volume reached to over 300 mm3 and ended on day 21 (n = 3‐4 mice per group). Y‐axis indicates tumor volumes, and x‐axis indicates days of treatment. P = 0.012. *P < 0.05 is indicated. (D and E) Immunohistochemical analysis of the xenograft tumors from mice treated with control antibody or M3G8 antibody. Representative microphotographs of images showing expression of PIP5K1α and VEGFR2 are shown in left panels and quantification of the staining intensity of the antibodies against these proteins in tumor cells are in shown in the right panels. Mean PIP5K1α expression in control‐treated and M3G8‐treated was 2.63 and 1.0, difference = 1.63, 95%Cl for control‐treated = 2.49‐2.76 and for M3G8‐treated = 0.72‐1.28, P = 0.01. Mean VEGFR2 expression in control‐treated and M3G8‐treated= 3.0 and 1.08, difference = 1.92, 95% Cl for M3G8‐treated = 0.77–1.4, P = 0.01). Tumors from the two groups (n = 3) were stained with the indicated antibodies and were evaluated. *P < 0.05 is indicated. The error bars indicate SEM. The student t‐test was used to determine the significance. The scale bars: 50 µm is indicated.
