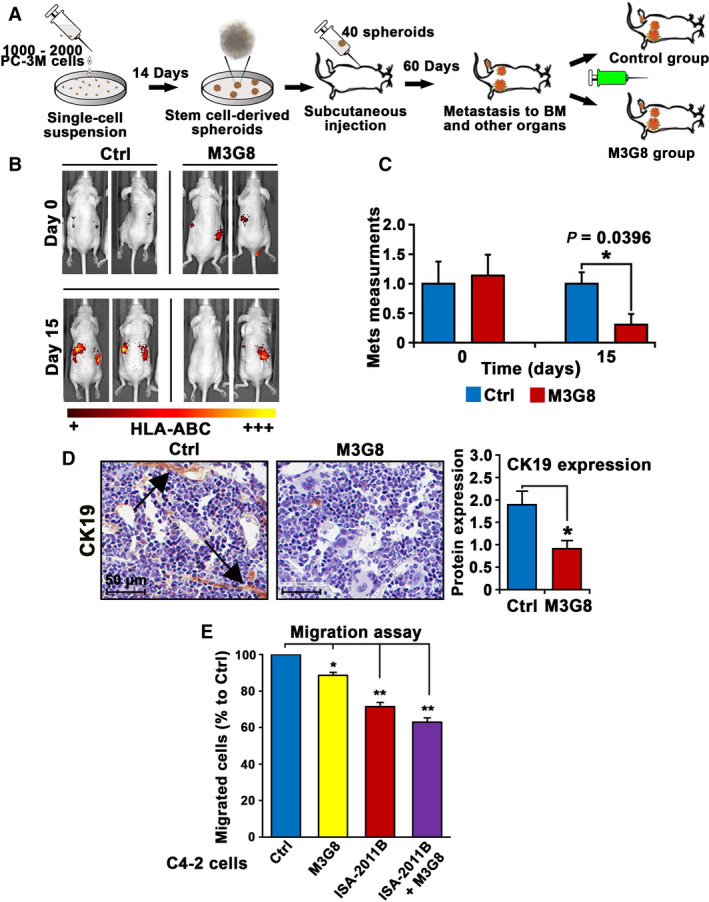
Fig. 7.

The effect of M3G8 on tumor growth and metastasis in xenograft mouse models. (A) Schematic illustration depicts the experimental procedures of establishment of distant metastasis including bone metastasis by using tumor spheroids derived from ALDHhigh PC‐3 M cells, and in vivo treatment regimens using M3G8 antibody. (B) Representative images to show the bioluminescent in vivo imaging on visualization of tumor metastasis in mice bearing metastasis and were treated with M3G8 or control antibodies. The signals were obtained by using fluorochrome‐conjugated HLA‐ABC antibody which was injected into the mice 6 h before applying mice on the IVIS imaging device. (C) Mean metastatic areas and intensity in pixels for Ctrl group (n = 4) and M3G8 group (n = 3) are shown. On day 0, P = 0.8257. On day 15 post‐treatment, mean value of metastatic areas plus signal intensity for control‐treated and M3G8‐treated groups was 250 and 76, difference = 174, 95% CI for control group = 185‐310, and for M3G8 group = 0–157, P = 0.039. The error bars indicate SEM. The student t‐test was used to determine the significance. (D) Representative microphotographs showing CK19‐positive cells in the bone marrow, indicating bone metastasis. Quantification of the staining intensity of CK19 in the bone marrow of the mice (n = 2–3) that were treated with Ctrl or M3G8 is shown in the right panel. The arrow heads point to the CK19‐positive tumor cells or tumor cell clusters. *P < 0.05 is indicated. The student t‐test was used to determine the significance. The scale bar: 50 µm is indicated. (E) The effect of M3G8 and ISA‐2011B alone or in combination on the migratory ability of C4‐2 cells was assessed by using the migration assays. After treatment with the agents, the equal amount of the cells from different groups was subjected to the Boyden chamber migration assay for 18 h. M3G8 treatment or ISA‐2011B treatment alone reduced migratory ability of C4‐2 cells as compared with that of controls (for M3G8, P = 0.016; for ISA‐2011B, P = 0.006). Combination of M3G8 and ISA‐2011B reduced the migratory ability of the cells as compared with that of controls (P = 0.003). Data are presented as average of two independent experiments (n = 2). **P < 0.01 and *P < 0.05 are indicated. The error bars indicate SEM. The student t‐test was used to determine the significance.
