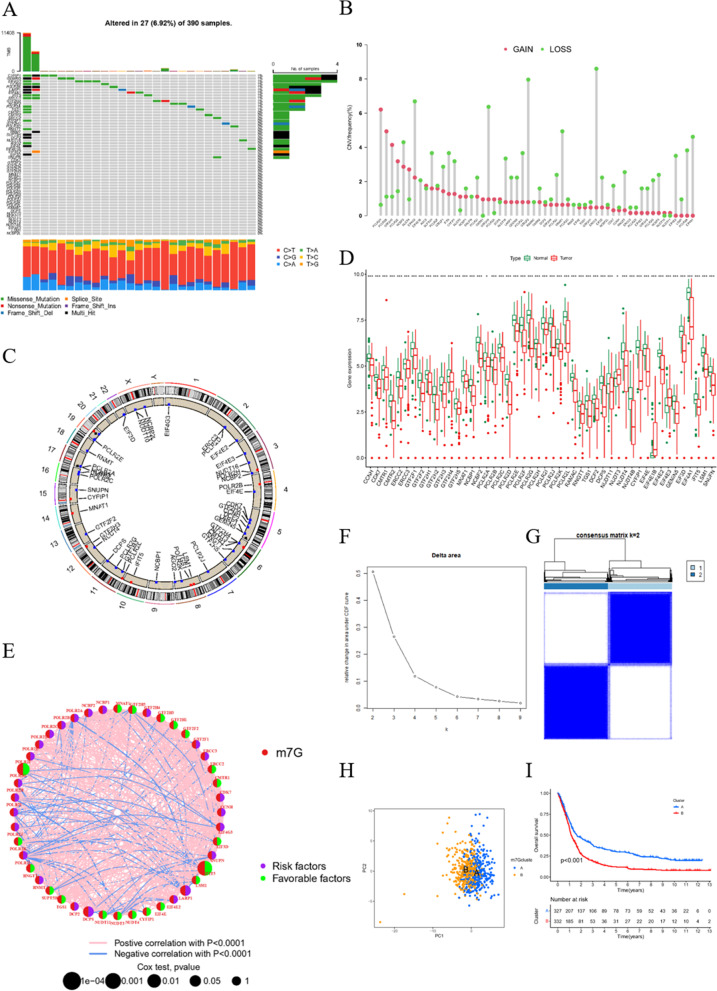
Fig. 1.
Variation of m7G related genes in glioblastoma. A CNV of m7G related genes in somatic cells. The mutation frequency is listed on the right. B Copy number of each m7G related gene in detail. GAIN infers to amplification and LOSS indicate deletion. C Gene location on chromosome with mutation information. Blue dots are identical to deletion and red dots are amplification. D Expression level of m7G related genes in normal and Glioblastoma samples. E Expression modification of m7G related genes and their roles in regulation. F Cumulative distribution function curve proves the most effect way of clustering. G Grouping based on the expression of m7G related genes. Group 1 indicate group A and group 2 means group B. H Group A and B are separated, proving the significance of grouping. I Survival analysis between group A and B. P < 0.05 is witnessed as significant

