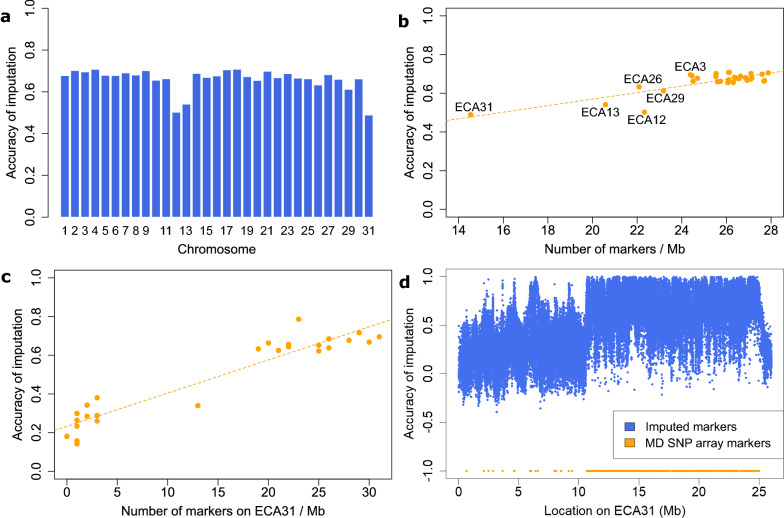
Fig. 4.
Accuracy of imputation from medium-density to sequence level. Imputation was performed using a reference panel of 162 horses (RP2) and the software Beagle 5.1. a Accuracy of imputation per chromosome. b Accuracy of imputation against marker density of the medium-density SNP array per chromosome. The dashed line indicates a linear regression model of y = 0.017x + 0.232 (adjusted R-squared: 0.669, p-value: 1.2 × 10⁻⁸). c Accuracy of imputation against marker density of the medium-density SNP array for the ECA31 chromosome. The dashed line indicates a linear regression model of y = 0.017 + 0.233 (adjusted R-squared: 0.896, p-value: 1.6 × 10⁻¹³). d Accuracy of imputation plotted against the position on ECA31, with positions of the medium-density (MD) SNP array shown in orange

