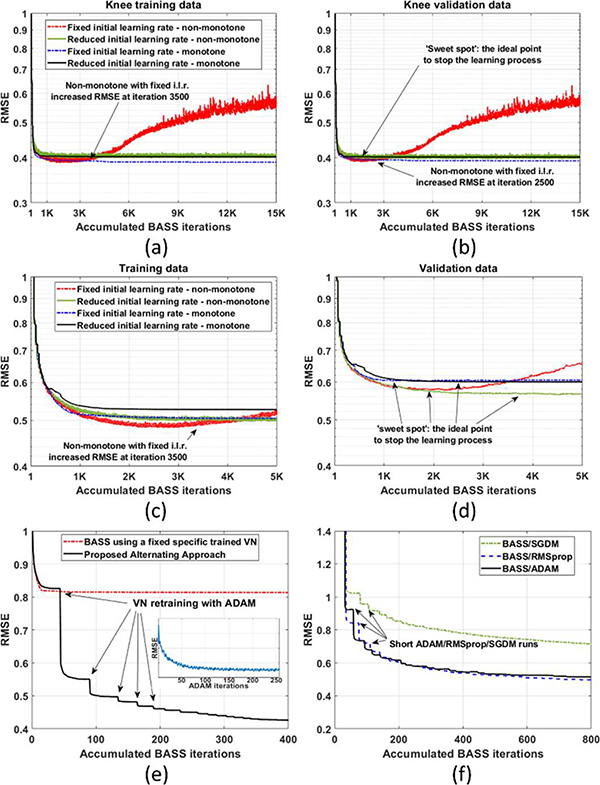
Fig. 3:
Curves of cost function over accumulated BASS iterations for the (a) training images and the (b) validation images for knee dataset, and (c)-(d) for brain dataset, showing the performance of the four alternating approaches. In (e), the original BASS with a fixed specific trained VN (no re-training) is compared with the proposed alternating approach, with the same initial conditions. In these figures, the discontinuities are due to the short runs of the ADAM algorithm. Only some runs are marked with arrows and an illustrative convergence curve for ADAM is shown in the small box. In (f) the convergence using other deep learning solvers, instead of ADAM, is shown.

