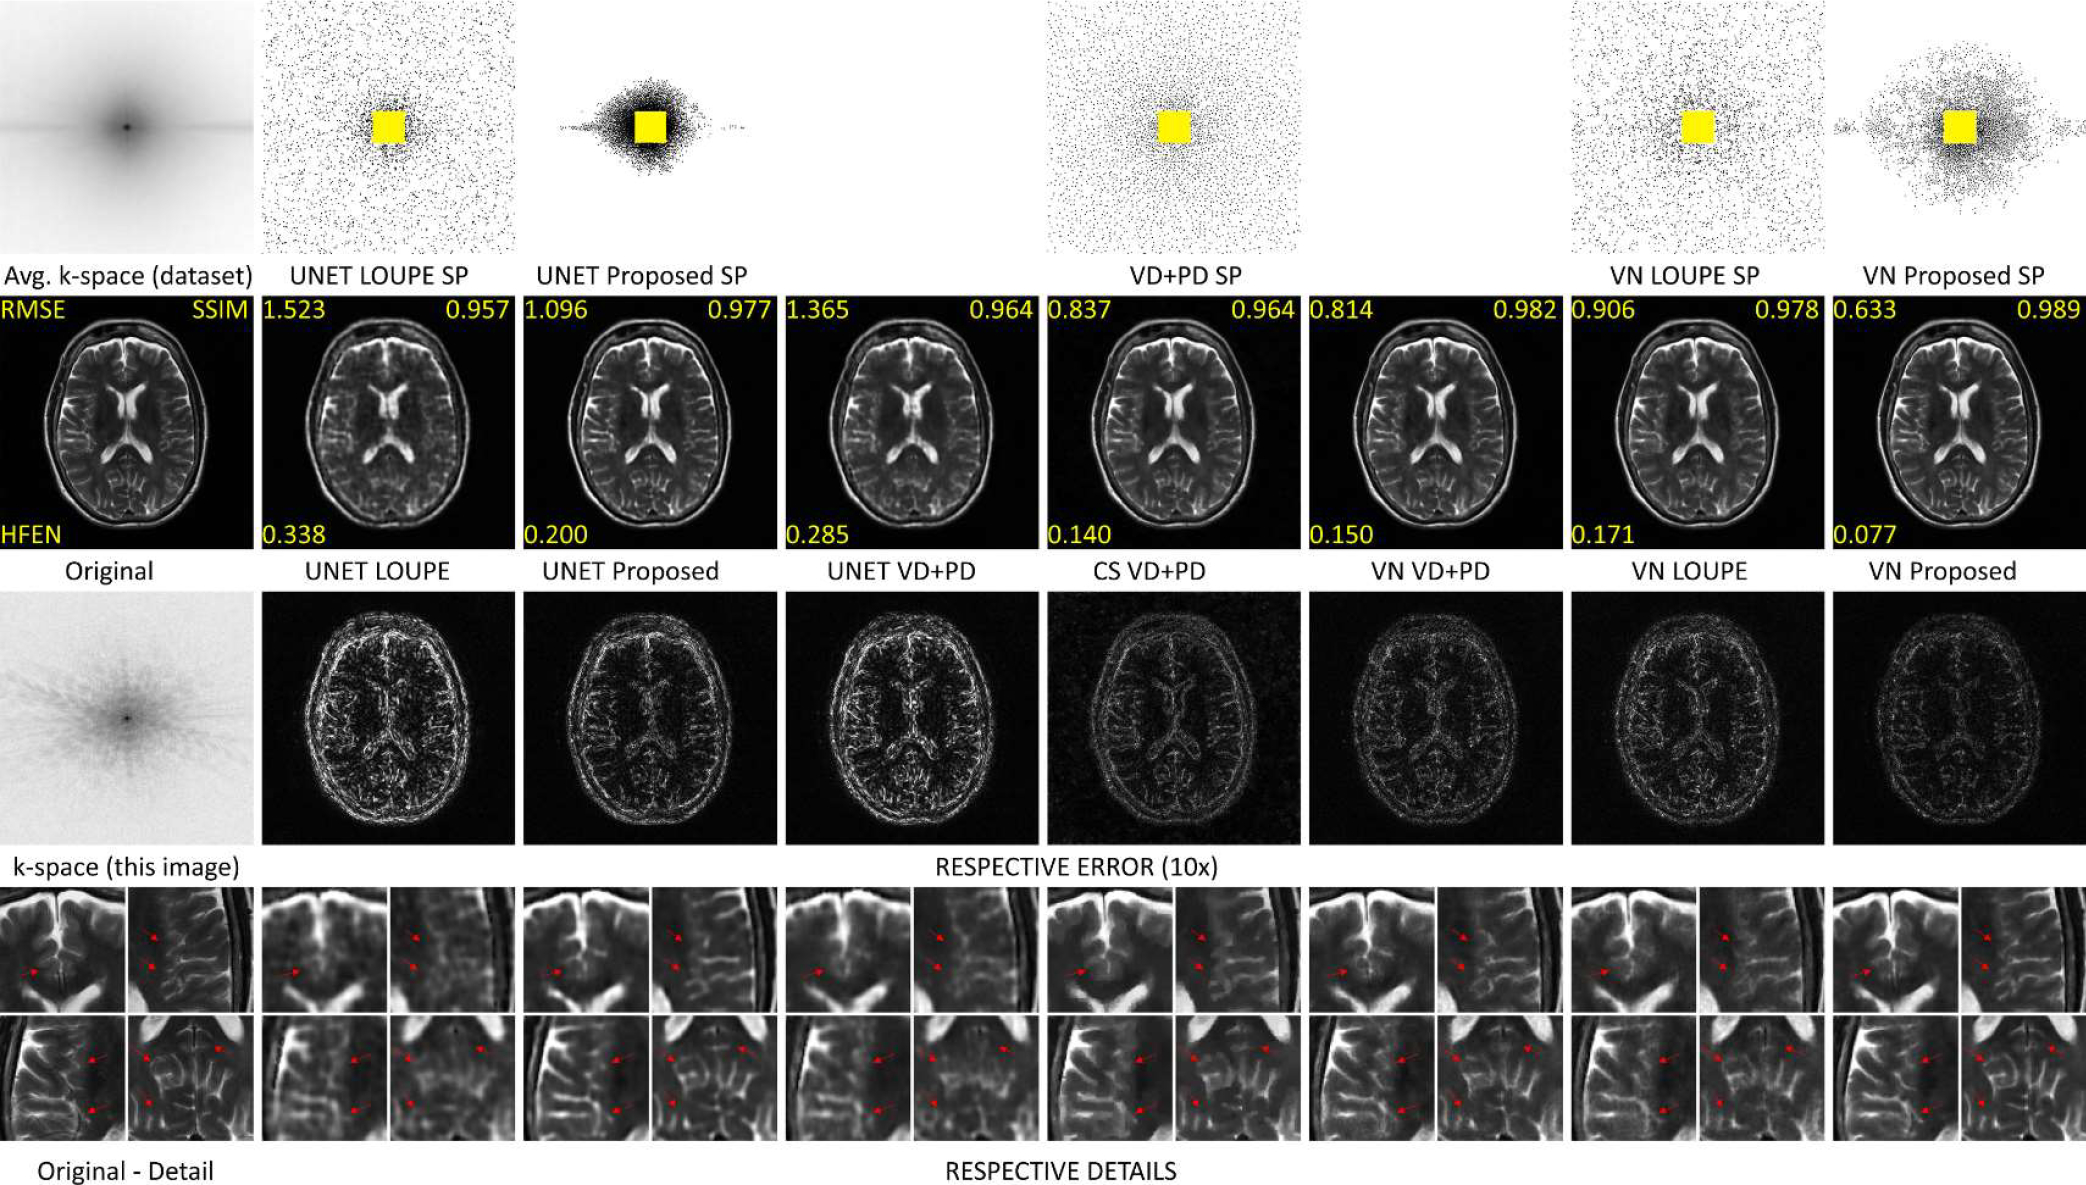
Fig. 8:

Comparing SP and images with brain dataset at AF=20. In the top row the average of the magnitude of the k-space of the training dataset and the SPs are shown. In the second row, the original reference image and the reconstructed images are shown, with their respective RMSE, SSIM, and HFEN. In the third row, the k-space of the reference image is shown, as well as the corresponding error maps of the reconstructions right above them. In the bottom row, the details of the reconstructed images of the same column are shown. Arrows point to the relevant structures in the detailed reconstructed images.
