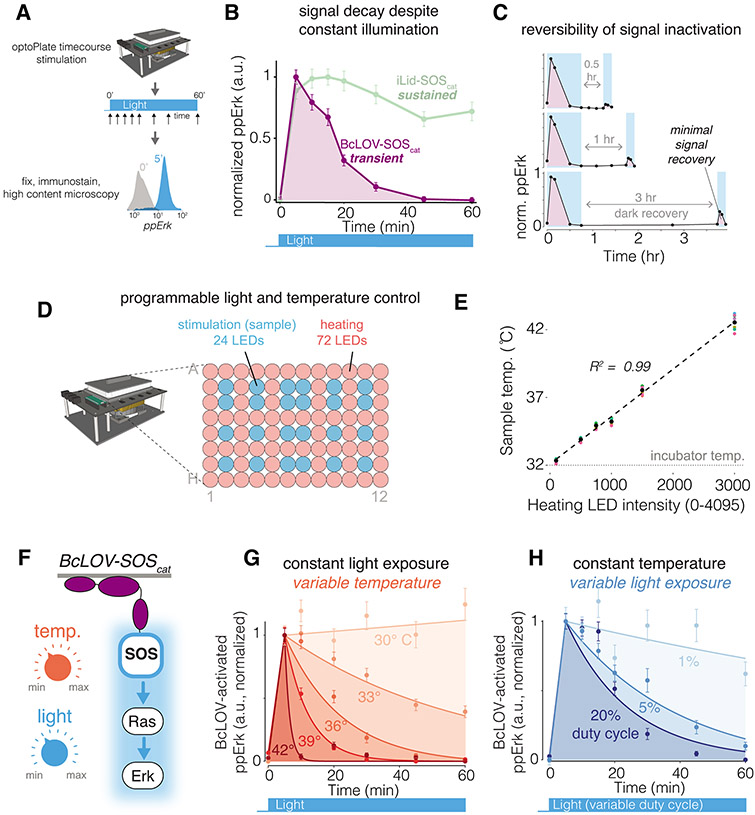
Figure 2. BcLOV-induced signaling dynamics depend on experimental temperature and light exposure.
A) Schematic of experimental protocol. B) Sustained stimulation of BcLOV-SOScat (160 mW/cm2 at 20% duty cycle) reveals that ppErk signal decays rapidly after an initial signal increase, whereas activation of iLID-SOScat remains sustained. C) Recovery (dark) periods of up to 3 hr after signal decay do not permit recovery of activatible BcLOV-SOScat, suggesting that BcLOV4 inactivation is effectively irreversible. D) BcLOV-SOScat signal dynamics were examined under variable light and temperature conditions. E) Schematic for how the optoPlate-96 was repurposed to allow independent control of experimental light and temperature conditions. For more information, see Supplementary Figure 7. F) Steady-state sample temperature was a linear function of the intensity of the 72 heater LEDs (precise intensity-temperature relationship should be determined empirically for each individual optoPlate). See Methods. G) At a given light exposure level (here, 160 mW/cm2 at 20% duty cycle), BcLOV-SOScat signal decays more rapidly at higher temperatures. H) At a given temperature (here, 36°C), BcLOV-SOScat decay increases with increased light exposure (variable duty cycles of 160 mW/cm2 light). Data points in B/C/G/H represent the mean +/− SEM of ~1000-4000 individual cells. Traces in G/H are exponential decay functions fit to data points at each temperature and duty cycle, as described in the Methods section. Data are normalized between the min and max of each trace. Normalization was performed separately for each temperature and duty cycle to highlight the change in the rate of BcLOV-SOScat inactivation rather than absolute signal. Absolute signal traces can be found in Supplementary Figure 8.

