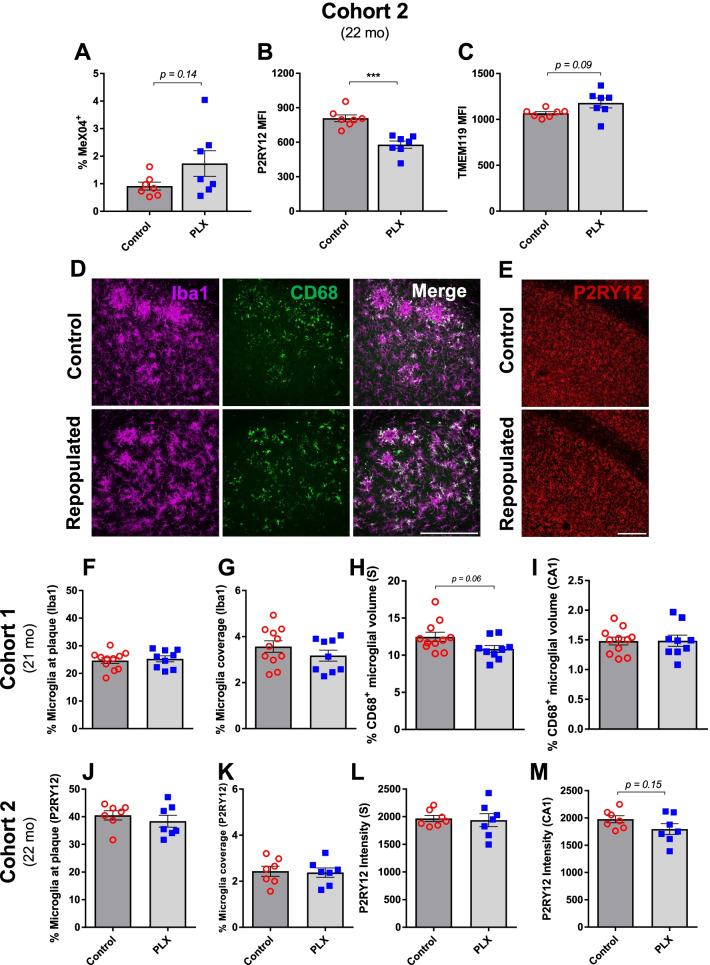
Fig. 3.
Repopulated microglia show similar recruitment to plaques but exhibit changes in homeostatic markers. Flow cytometry revealed no significant difference in microglia internalization of MeX04 in the two groups but showed a trend toward a higher percentage of MeX04+ microglia with PLX treatment (A). Microglial levels of P2RY12 (B) were significantly lower, while TMEM119 levels (C) were mildly elevated in PLX-repopulated group compared to the control. Representative immunofluorescent 40× images of the subiculum in the control and PLX-repopulated groups showing microglia (Iba1, magenta) and CD68 (green) in the first cohort of 3xTg mice (D). Representative immunofluorescent 20× images of the CA1 in the control and PLX-repopulated groups showing P2RY12 (red) in the second cohort of 3xTg mice (E). Scale bars represent 200 µm. Microglia in both cohorts showed no difference in their recruitment to plaque (F, J) as well as their total coverage (G, K) between control and PLX-repopulated groups. Levels of CD68, a marker of activated microglia, were slightly lower in the PLX-treated group in the subiculum (H) but not in the CA1 (I). The intensity of P2RY12, a homeostatic maker of microglia, was similar between treatments in the subiculum (L) but showed a trend toward being lower in the PLX-repopulated group in the CA1 region (M) as analyzed by immunohistochemistry. Student’s t-test (Welch’s corrections for A and C), ***p < 0.001. Data are presented as mean ± SEM (Cohort 1: n = 9–11; Cohort 2: n = 7)

