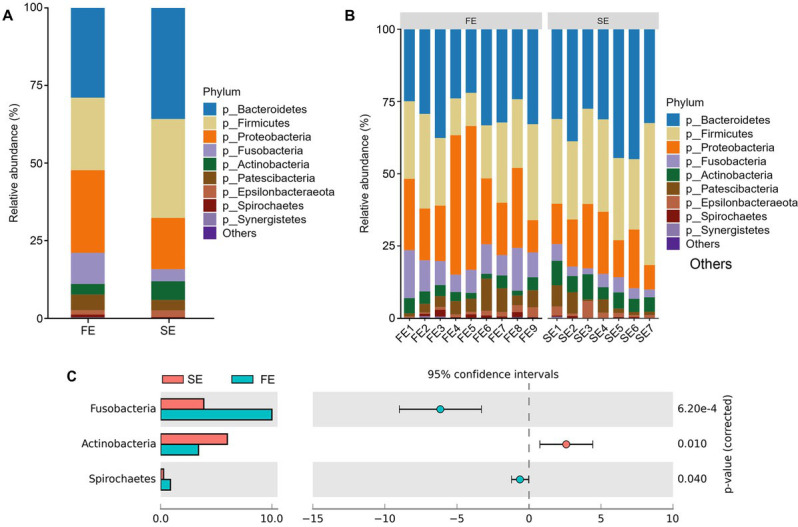
Fig. 3.

Component analysis of community structure.
A) Relative abundances of the ten most abundant bacterial phyla in the FE and SE groups; B) relative abundances of the indicated individuals’ ten most abundant bacterial phyla; C) t-test analysis comparing oral microbiota composition between the FE and SE groups.
