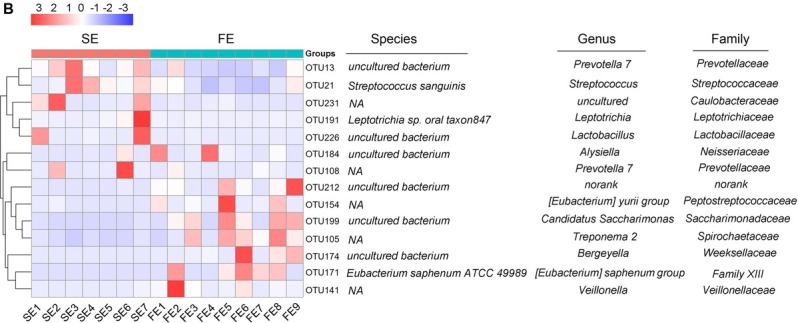
Fig. 4.

Correlation analysis of microbial environmental factors.
E) KEGG analysis diagram; n = 7 for the SE group, n = 9 for the FE group; SE – patients with successful eradication therapy, FE – patients with failed eradication therapy.

Correlation analysis of microbial environmental factors.
E) KEGG analysis diagram; n = 7 for the SE group, n = 9 for the FE group; SE – patients with successful eradication therapy, FE – patients with failed eradication therapy.