FIGURE 5.
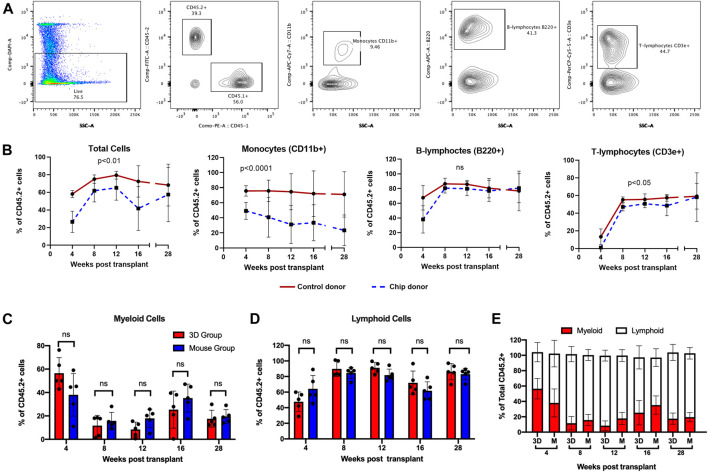
Differentiation of LSK transplanted into mature peripheral blood phenotypes over time. (A) Gating strategy for flow cytometry analysis at 4, 8, 12, 16, and 27-weeks post-transplantation. CD11b+, B220+, and CD3e+ were gated from CD45.2+ live cells. (B) Quantification of CD45.2+ donor cells in total cell, CD11b+ monocyte, B220+ B-lymphocyte, and CD3e+ T-lymphocyte populations. (C) Chip grown CD45.2+ cells gave rise to myeloid cells at a similar frequency to mouse control. Quantification was performed by gating CD11b+ cells within CD45.2+ populations. (D) Chip CD45.2+ cells engrafted into mature lymphoid populations similar to the mouse control group. Data are shown as combined percentage of B220+ and CD3e+ cells in CD45.2+ cells. The gating strategy for (C and D) is provided in Supplementary Figure S4. (E) Graph showing the percentage of myeloid and lymphoid cells in total CD45.2+ peripheral blood cells. All flow analysis was performed using FlowJo v10. Statistical analysis for (B) was performed using restricted maximum likelihood (REML). N = 5 per group. Statistical analysis for (C,D) was performed using multiple Mann–Whitney tests.

