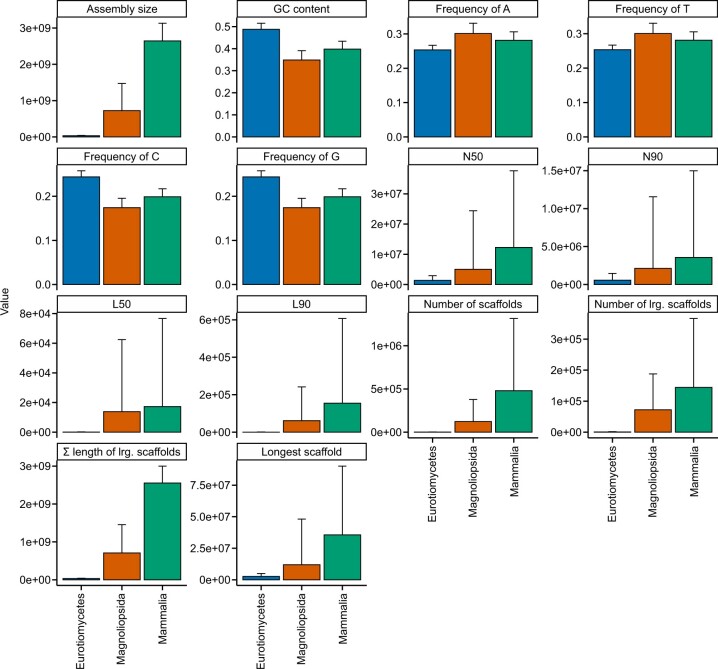
Fig. 3.
Summary of genome assembly metrics across 901 genomes from 3 eukaryotic classes. Nine hundred and one scaffold-level genome assemblies from 3 major eukaryotic classes [215 Eurotiomycetes (kingdom: Fungi), 336 Magnoliopsida (kingdom: Plantae), 350 Mammalia (kingdom: Animalia)] were obtained from NCBI and examined for diverse metrics including assembly size, GC content, frequency of A, T, C, and G, N50, N90, L50, L90, number of scaffolds, number of large scaffolds (defined as being greater than 500 nucleotides, which can be modified by the user), sum length of large scaffolds, and longest scaffold in the assembly. Bar plots represent the mean for each taxonomic class. Error bars represent the standard deviation of values. This figure was made using ggplot2 (Wickham 2009) and ggpubfigs (Steenwyk and Rokas 2021a).

