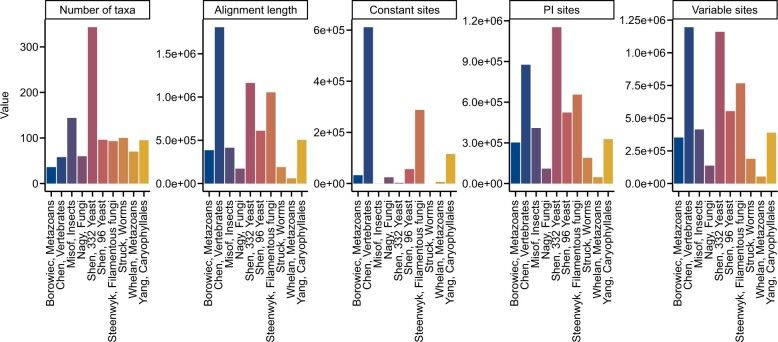
Fig. 4.
Summary metrics among multiple sequence alignments from phylogenomic studies. Multiple sequence alignments of amino acid sequences from 10 phylogenomic data matrices (Misof et al. 2014; Nagy et al. 2014; Borowiec et al. 2015; Chen et al. 2015; Struck et al. 2015; Whelan et al. 2015; Yang et al. 2015; Shen, Zhou, et al. 2016; Shen et al. 2018; Steenwyk et al. 2019) were examined for 5 metrics: number of taxa, alignment length, number of constant sites, number of parsimony-informative sites, and number of variable sites. The x-axis depicts the last name of the first author of the phylogenomic study followed by a description of the organisms that were under study. The abbreviation PI represents parsimony-informative sites. Although excluded here for simplicity and clarity, BioKIT also determines character state frequency (nucleotide or amino acid) when summarizing alignment metrics. This figure was made using ggplot2 (Wickham 2009) and ggpubfigs (Steenwyk and Rokas 2021a).

