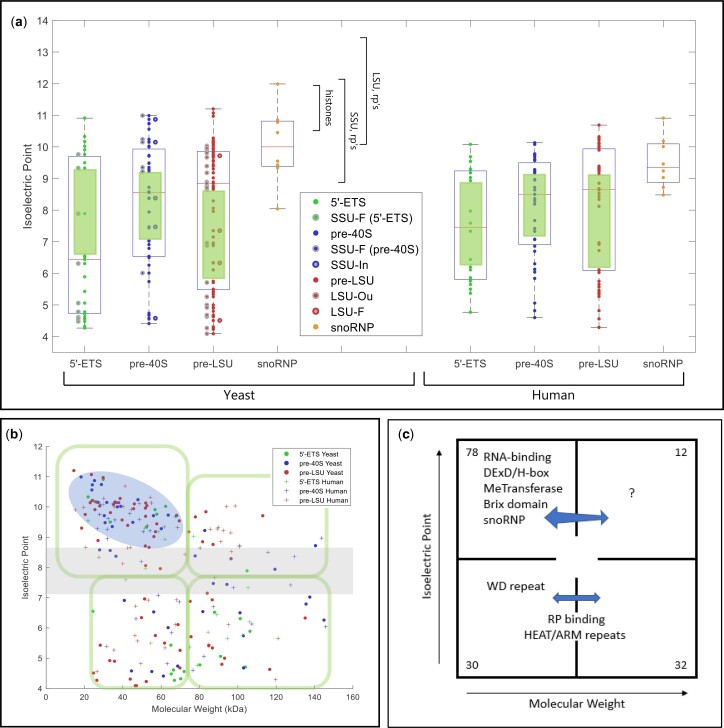
Fig. 3.
Physical parameters and motifs of AFs. a) IEP of yeast and human AFs. AFs were grouped to illustrate the characteristics of those that associate with the 5′-ETS, the pre-40S segment, or the pre-LSU segment (see Fig. 1a). The central column of values includes all relevant AFs listed in Supplementary Table 2. For the 5′-ETS, the points to the left are SSU-F. For the pre-40S, the points to the left are SSU-F and the points to the right are SSU-In. For the pre-LSU, the points to the left are LSU-Ou and the points to the right are LSU-F. Human AFs are subgrouped according to the information for their yeast homologs. The gap/thinning in the IEP plot around neutral pH is marked by green boxes. Supplementary Table 4 lists the extreme values of physical parameters for AFs. Outlier AFs for each subset were calculated based on the IQR rule (see Materials and Methods). Human AFs are subgrouped according to the information for their yeast homologs. The IEPs of yeast histones and yeast ribosomal proteins are indicated by brackets. A subset of ribosomal proteins is much more acidic (RPS0A, RPS0B, RPS12, RPS21A, RPS21B, RPL5, RPL22A, RPL22B, RPP0, RPP1A, RPP1B, RPP2A, RPP2B). Many (perhaps all) of these are added after export. b) Nucleolar AF 2D plot. Molecular weights and IEPs of yeast and human AFs associated with each of the three domains (5′-ETS, pre-40S, pre-LSU). The 4 quadrants are discussed in the text. The pale blue oblong encloses the most obvious of the subgroupings. The gray horizonal band highlights the pH neutral zone in which there are few AFs. The plots in Fig. 3, a and b display the intrinsic properties of AFs; however, the characteristics of nascent rRNPs also depend on 1) covalent modifications of AFs and RNA (ubiquitylation, methylation, phosphorylation, etc.); 2) the length of the progressively elongating rRNA itself; and 3) the growing complement of ribosomal proteins. The stoichiometry of most of these post-translational modifications is unknown. c) Diagrammatic summary of enrichment of yeast AFs in distinct quadrants. The 4 quadrants identified in (b) are indicated schematically, along with the names of groups of AFs that are enriched in distinct quadrants. The numbers in the corners indicate the total number of yeast AFs in each quadrant defined by the green enclosures in (b). Blue arrows are positioned asymmetrically to indicate quadrant bias. RP, ribosomal proteins. d) Hierarchical clustering of yeast AFs. AFs were clustered by amino acid sequence and annotated by reference to motifs that occur in at least 2 AFs in the Saccharomyces Genome Database. Subunits of RNA polymerase A are included, as well as AFs that localize primarily to the nucleoplasm or cytoplasm. The colored ovals along the top correspond to the prototypic motif signatures in Supplementary Table 5. The open/white ovals designate AFs that lack motif signatures as well as the subunits of RNA polymerase A. Motifs are listed along the vertical axis on the left. The phylogenetic tree of yeast proteins was generated based on the multiple sequence alignments by Clustal Omega (Sievers and Higgins 2018). The protein domains shared by 2 or more than 2 genes were included in our study to generate the 2D map.

