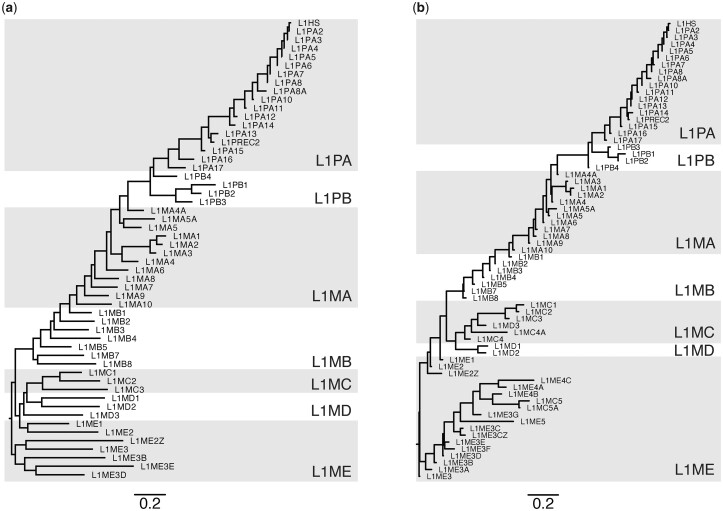
Fig. 4.
Phylogenetic relationships between CSs, compared with expected subfamily relationships. a) Phylogeny built using a Muscle (Edgar 2004) alignment of full (typically 6–8 kb) CSs for 54 of the 67 L1 subfamilies. The maximum likelihood phylogeny was produced using FastTree (Price et al. 2009) with a general time reversible substitution model. b) Phylogeny built using Dfam 3′ end consensus models (median length: 925 bp) for 67 L1 subfamilies, using the same method as (a).

