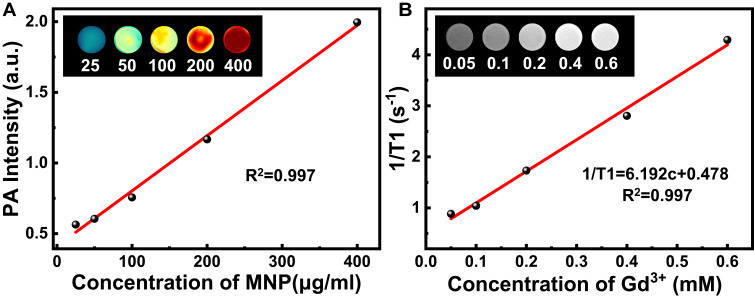
Figure 2.
In vitro PA and MR imaging studies of TDMVs+MNP-Gd. (A) PA images of TDMVs+MNP-Gd at various concentrations (25, 50, 100, 200 and 400 μg/mL). (B) T1-weighted MR images and relaxivity measurements of TDMVs+MNP-Gd with different Gd3+concentrations (0.05, 0.1, 0.2, 0.4 and 0.6 mM). The T1 relaxation rate as a function of Gd3+ concentrations.

