Figure 3.
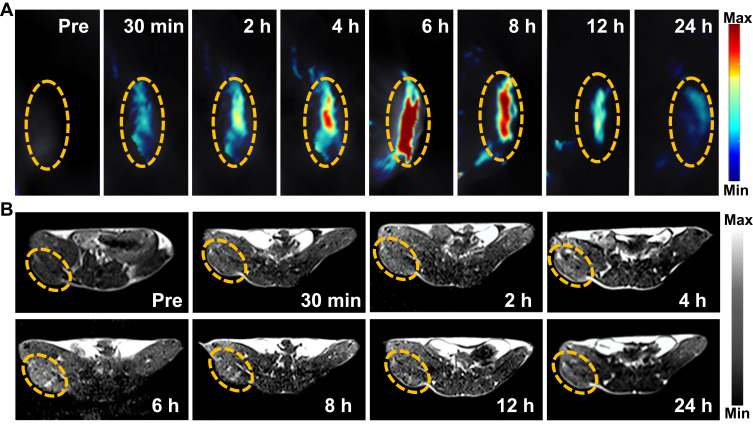
In vivo PA and MR imaging studies of TDMVs+MNP-Gd. (A) PA images in the tumor region collected by using the MOST imaging system before (pre) and at various time points after injection of TDMVs+MNP-Gd. (B) T1-Weighted MR axial images of tumor-bearing mice before (pre) and at various time points after injection of TDMVs+MNP-Gd using 3.0 T clinical MRI equipment. The yellow circles point to the tumor sites.

