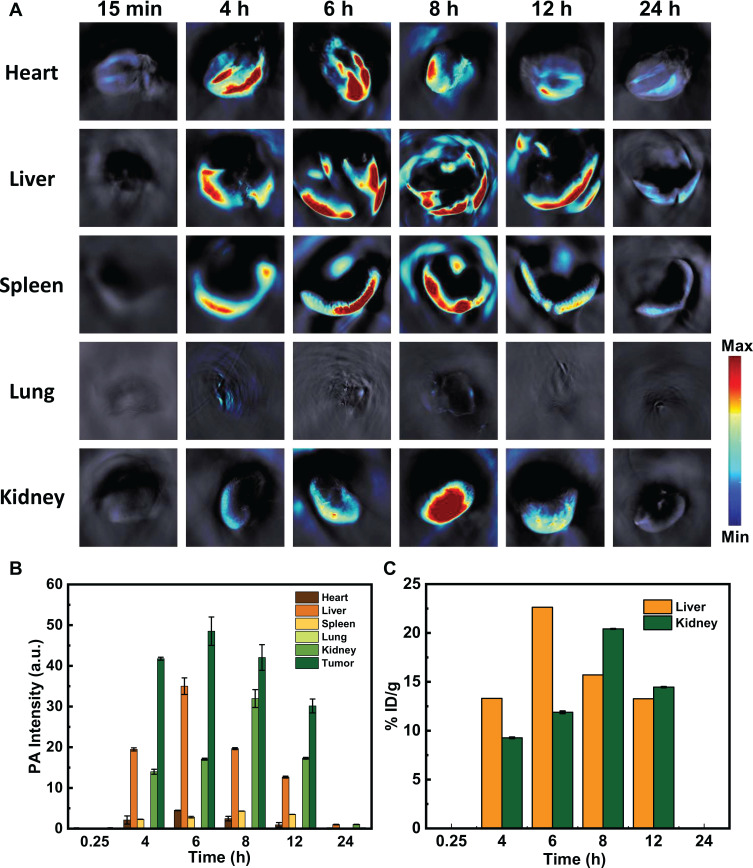
Figure 4.
Biodistribution of the TDMVs+MNP-Gd. (A) Biodistribution of the TDMVs+MNP-Gd in main organs after i.v. injection into the tumor bearing mice using PA imaging at various time points. (B) PA signal intensities at various time points in tumors and the other organs. (C) Biodistribution of the TDMVs+MNP-Gd in liver and kidney after i.v. injection into the tumor bearing mice at various time points as determined by measuring Gd3+ concentrations in tissue lysates using ICP-MS.

