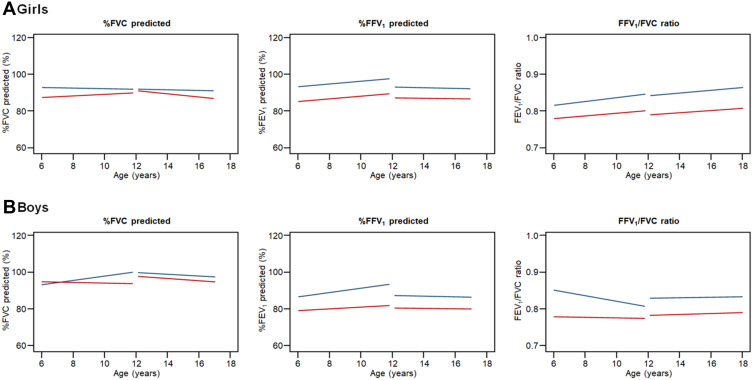
Figure 3.
Between-group comparison of the slopes for lung function growth in girls and boys from the ages of 6 years to 17 years.
Notes: %FVC predicted, %FEV1 predicted, and FEV1/FVC ratio in Girls (A) and Boys (B). The slopes with poor and good control groups are shown in red and blue lines, respectively. We performed between-group comparisons of the slopes of %FVC predicted, %FEV1 predicted, and FEV1/FVC ratio growth in the two age groups (ages: 6–11 years and 12–17 years).

