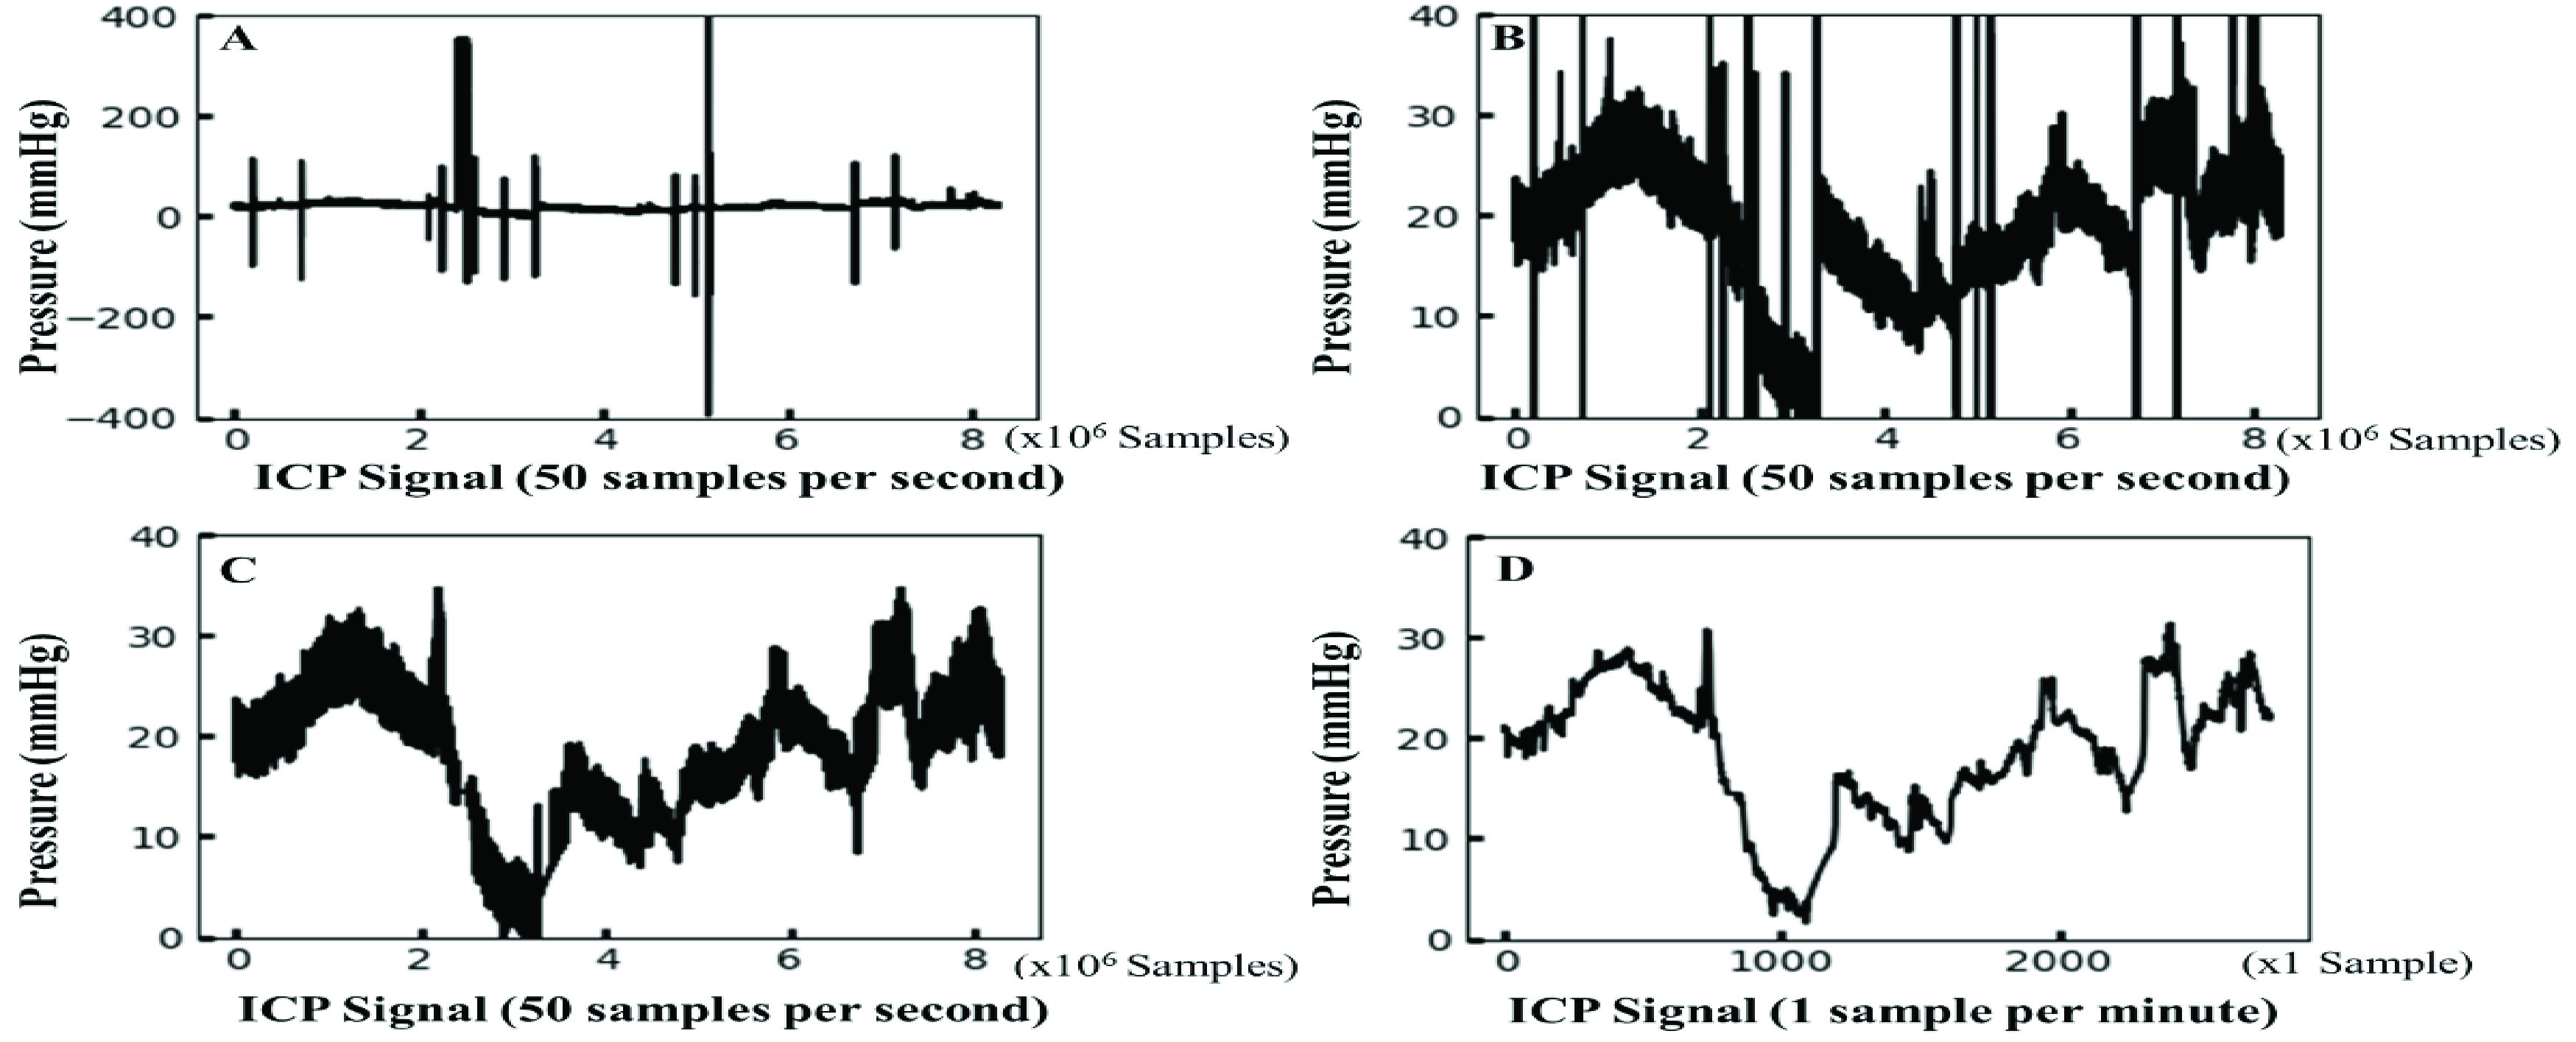
FIGURE 2.

Resulting plots illustrating the data preprocessing steps (all sampling points are plotted). A. the raw ICP data plot (from the 6th patient); B. the resulting data plot after data thresholding; C. the resulting data plot after applying the smoothing technique. In A, B, and C, the sampling frequency is 50 samples per second (0.02 second per sample), and the scale of the x-axis is 106 samples D. an outcome plot of the data preprocessing steps where the sampling frequency is reduced to 1 sample per minute (60 seconds per sample), and the unit of the x-axis is one sample per minute.
