FIGURE 3.

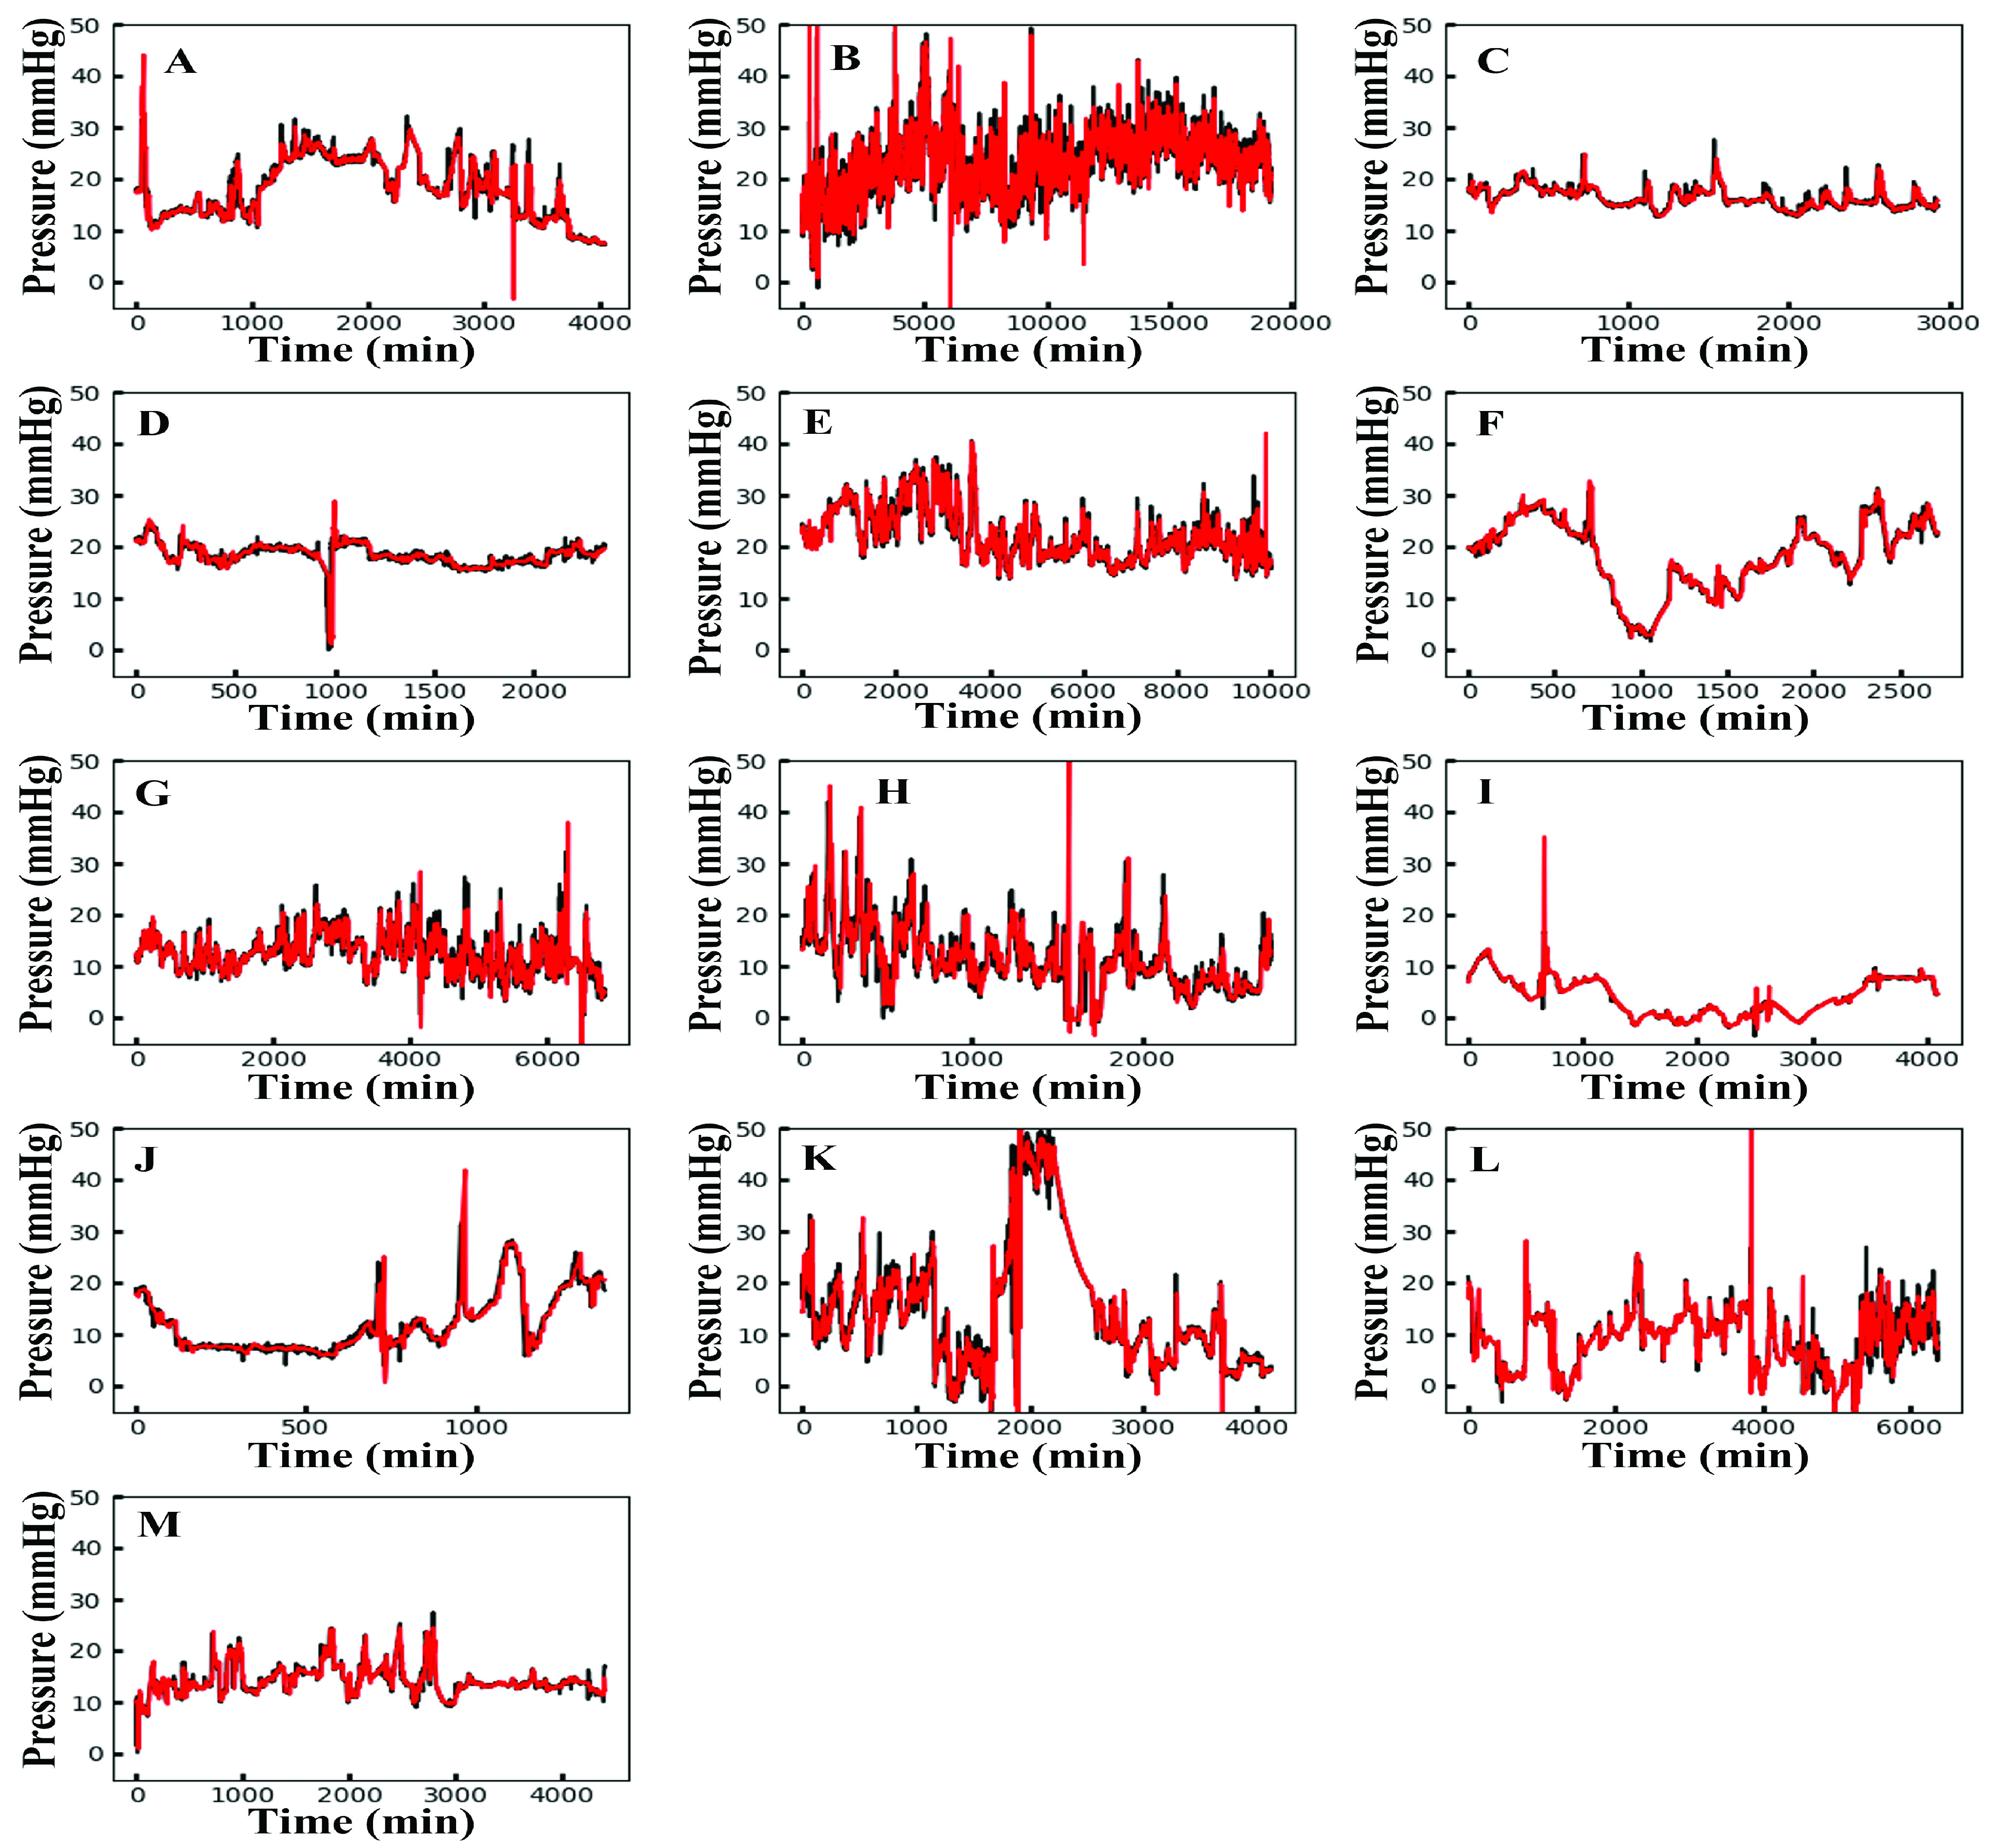
The ICP prediction plots for all 13 patients. The predicted ICP data from the proposed method are labeled in red; the actual ICP data are labeled in black. The patient ID numbers (from 1 to 13) are labeled alphabetically from A to M.

The ICP prediction plots for all 13 patients. The predicted ICP data from the proposed method are labeled in red; the actual ICP data are labeled in black. The patient ID numbers (from 1 to 13) are labeled alphabetically from A to M.