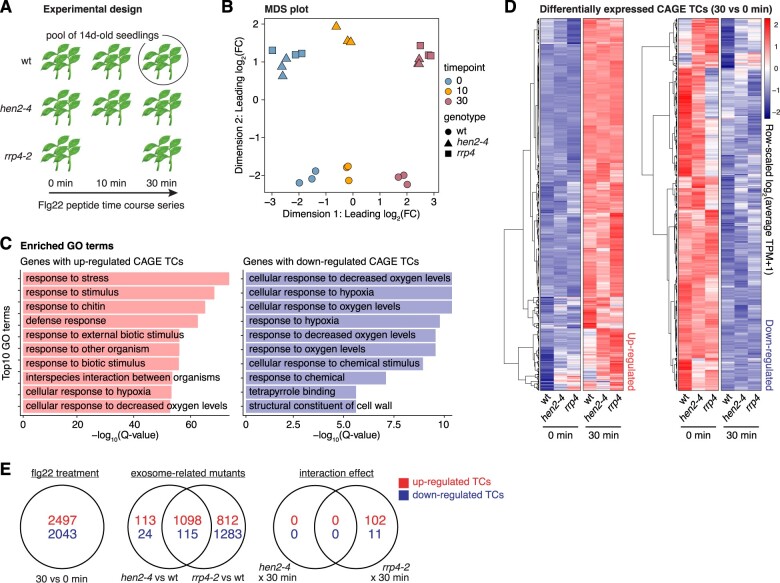
Figure 1.
Experimental setup and validation of PTI response. A, Overview of experimental design. Pools of 14-day-old seedlings from wt and two exosome-related mutants (hen2-4 and rrp4-2, see “Materials and methods”) were subjected to flg22 treatment in biological triplicates followed by CAGE library preparation and sequencing at the set time points. The fls2 mutant was included in the time course for initial validation of the treatment. B, MDS plot. X- and Y-axes show the first two dimensions. Each point corresponds to a CAGE library, colored by time of flg22 treatment. Shapes indicate genotype. Axes are scaled as leading log2 FC; the root-mean-squared average of the log2 FC of the top 1,000 genes best separating each sample. C, Enriched GO terms of genes with CAGE TCs responding to the flg22 treatment of wt after 30 min. X-axis shows P-values after correction for multiple testing and log transformation. Y-axis shows the top 10 enriched terms. Terms for genes with upregulated (red) and downregulated (blue) CAGE TCs are shown in left and right panels, respectively. D, Hierarchical clustering of CAGE TCs that were significantly upregulated (left heatmap) or downregulated (right heatmap) at 30 min after flg22 treatment versus 0 min. Each row represents a CAGE TC. Color indicates row-scaled, TPM-normalized expression. E, Venn diagram of differentially expressed CAGE TCs across experimental conditions. Top (red) and bottom (blue) numbers show up- and downregulation, respectively. “Flg22 treatment” shows TCs responding to the flg22 induction at 30 min compared to control (0 min). “Exosome-related mutants” denote the comparisons of hen2-4 and rrp4-2 to wt samples. The “interaction effect” captures TCs whose response differs due to the interaction of exosome-related mutants and flg22 treatment at 30 min.

