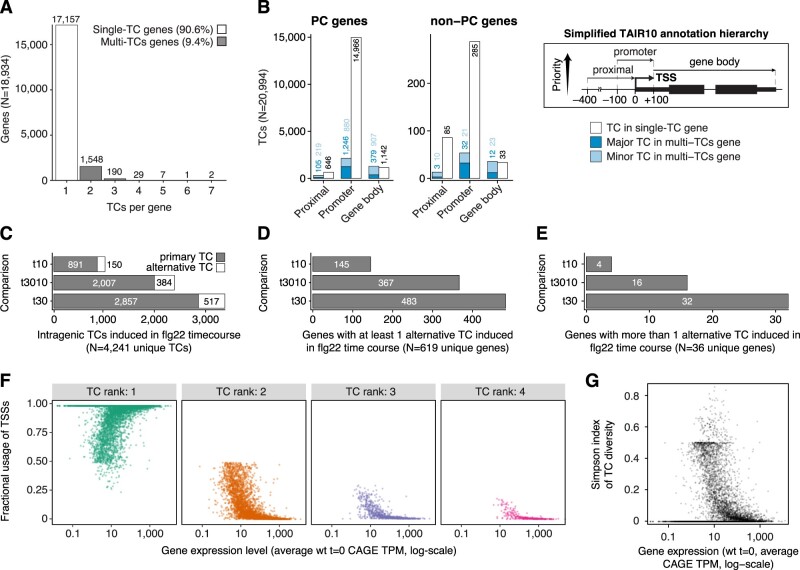
Figure 2.
Alternative TSS usage in PTI. A, Extent of alternative TSSs. Y-axis shows the number of genes having a set number of TCs (X-axis). Only intragenic TCs contributing at least 10% to the expression of their cognate gene were considered (see “Materials and methods”). Bar colors distinguish single-TC from multi-TCs genes. B, Annotation of intragenic TCs. Number of TCs (Y-axis) overlapping TAIR10 genomic features (X-axis) based on a simplified hierarchical annotation system (right). Left parts show data for PC genes, middle parts for non-PC genes. Bar colors indicate whether the TC category originates from a single- or multiple-TCs gene, and whether TCs are the major contributor (dark shade) or minor contributors (light shade) to the expression of their cognate gene. C, X-axis shows the number of differentially expressed intragenic TCs in the flg22 time course. Y-axis shows the time point comparison used for differential expression analysis: t10 (10 versus 0 min), t3010 (30 versus 10 min), and t30 (30 versus 0 min). Bar colors indicate whether CAGE TCs are located within ±100 bp from the most upstream 5′-end of TAIR10 gene models (primary TC) or not (alternative TC). D and E, X-axis show the number of genes with at least one (D) or more than one (E) alternative TC induced during the flg22 time course. Y-axes are organized as in (C). F, Fractional usage of CAGE TCs (Y-axis) as a function of gene expression (X-axis, log-scaled) for multi-TCs genes. CAGE TCs are grouped according to their rank of gene expression contribution, with rank 1 representing dominant TCs, that is, the TCs contributing most to the expression of their cognate genes. Only ranks 1–4 are shown. G, Plot of Simpson index of CAGE TC diversity (Y-axis) against gene expression level (X-axis, log-scaled).

