Figure 3.
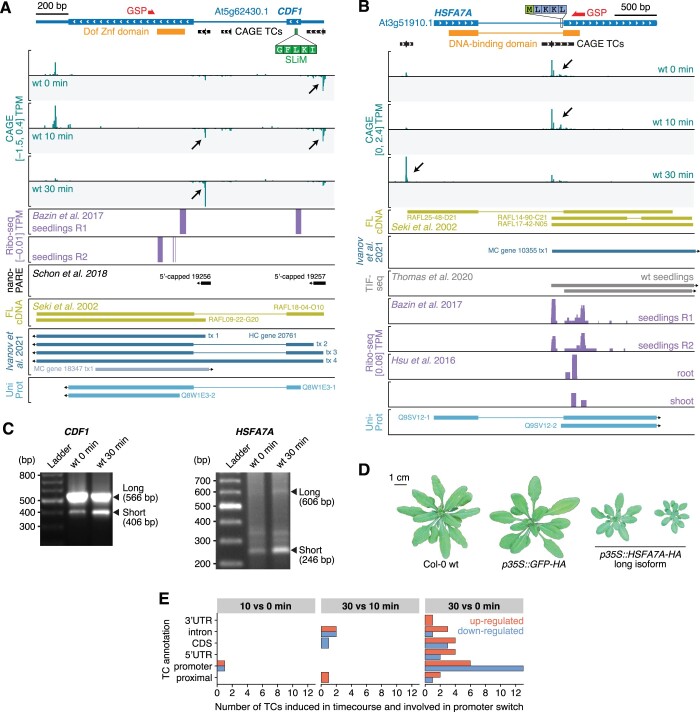
Examples of promoter switches in PTI. A, Genome browser view of the CDF1 gene. The TAIR10 gene model is shown on top with large and thin blue blocks indicating coding regions and untranslated regions, respectively. Blue lines represent introns. White arrows indicate direction of transcription. Protein domains are shown in orange. CAGE TC are shown as black blocks with the tick marking the TC peak position. The SLiM in CDF1 required for TOPLESS binding is indicated by a green block, along with its amino acid sequence. The 5′-RACE GSP used in (C) is marked by a red arrow. Bottom tracks show CAGE signal expressed in average TPMs across wt replicates for 0, 10, and 30 min following flg22 treatment in green. Negative CAGE signal indicates antisense initiation of transcription. Violet tracks show Ribo-seq signal in two seedling replicates (Bazin et al., 2017). Black arrows highlight important changes in CAGE TCs usage during the time course (see main text). The black track shows 5′-capped transcripts detected by nano-PARE by Schon et al. (2018). Evidence from full-length cDNAs (FL-cDNA; Seki et al., 2002) is shown in the gold track, followed by transcriptome annotation in dark (sense) and light blue (antisense) from Ivanov et al. (2021), and UniProt proteins in sky blue. B, Genome browser view of the HSFA7A gene, organized as in (A), with one supplementary track showing transcript isoform sequencing (TIF-seq) data from Thomas et al. (2020). C, PCR fragments obtained by 5′-RACE with CDF1 and HSFA7A GSPs (see (A) and (B)). Reference sizes are indicated on the left side in bp (Ladder). First and second samples are used as input RNA from wt seedlings at 0 and 30 min after flg22 treatment, respectively (see “Materials and methods”). Fragments corresponding to the long and short transcript isoforms (based on alternative transcription initiation events detected by CAGE) are indicated by black arrows on the right side. D, Rosette phenotypes of independent transgenic lines constitutively expressing the HSFA7A long isoform or GFP, and of nontransgenic Col-0 wt Arabidopsis plants, as indicated. E, Annotation of CAGE TCs involved in promoter switches during flg22 time course. X-axis shows the number of TCs falling in each annotation category (Y-axis, see Figure 2B, right). Bar colors indicate downregulation (blue) or upregulation (red) for each of the time course comparisons (columns).

