Figure 7.

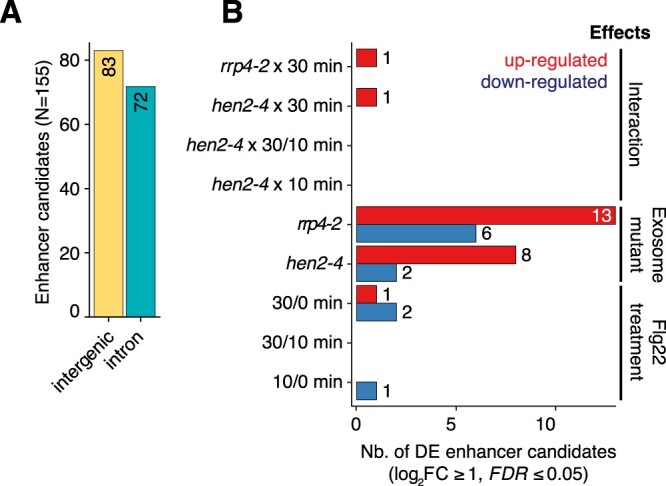
CAGE-defined enhancer candidates. A, Number of CAGE-defined enhancer candidates (Y-axis) in intergenic or intronic regions (X-axis). B, Differential expression analysis of enhancer candidates using CAGE expression. X-axis shows the number of enhancer candidates differentially expressed as a result of the comparisons (Y-axis) which are classified in three main effects: flg22 treatment (minutes), exosome-related mutant genotypes (rrp4-2 or hen2-4), and the interactions thereof (e.g. rrp4-2 x 30 min). Red and blue bars indicate upregulation and downregulated enhancer candidates, respectively.
