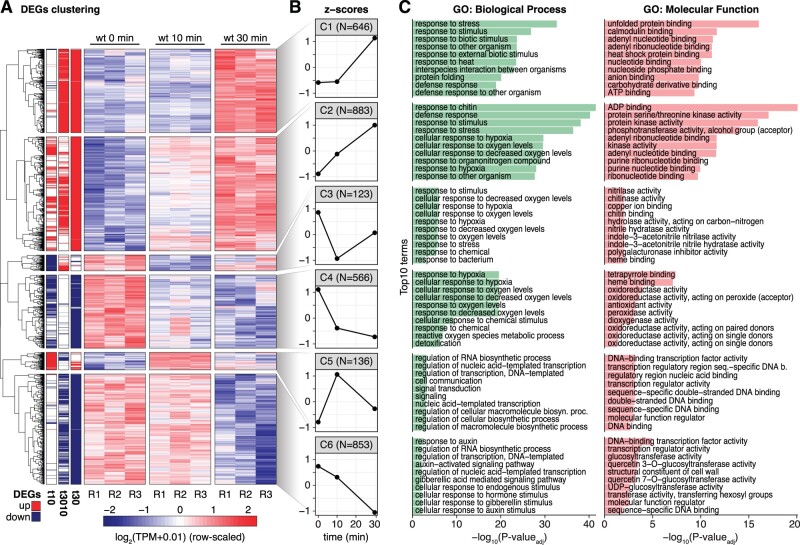
Figure 8.
Gene expression clustering of the PTI transcriptional response. A, Heatmap of DEGs (rows) in the flg22 treatment time course. Left three columns indicate upregulation (red) or downregulation (blue) status according to the comparisons (from left to right: 10 versus 0 min, 30 versus 10 min, 30 versus 0 min). Remaining columns show wt replicates for each time point. Colors represent row-scaled, normalized CAGE expression. Vertical blocks separate the six gene expression patterns identified by hierarchical clustering. B, Z-score (Y-axis) of the average gene expression for each of the six clusters defined in (A) (C1–C6). X-axis shows flg22 treatment time in minutes. C, Top 10 enriched GO terms in each DEG cluster defined in (A), organized as in Figure 1C. The two independent GO categories are separated (left, biological processes; right, molecular functions).

