Figure 9.
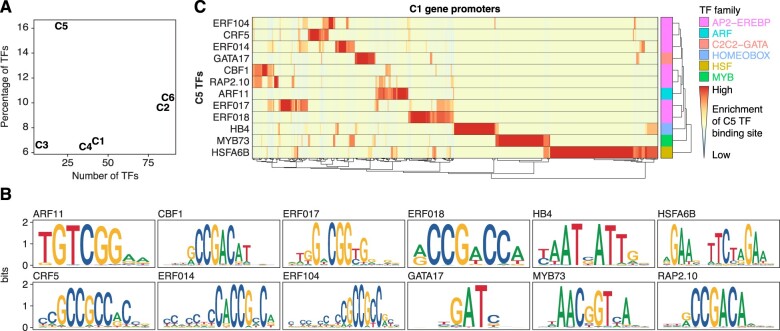
Promoters of PAMP response genes are enriched in C5 TF binding sites. A, TF genes in the DEG clusters. X-axis shows the number of known TFs in each of the six expression clusters from Figure 8A. The Y-axis shows the ratio of number of TFs to the total number of genes in each cluster. B, Sequence logos of cluster 5 TFs for which a profile could be retrieved from the JASPAR database (see “Materials and methods,” Supplemental Data Set 9). Y-axis shows information content in bits. C, Enrichment of binding sites from C5 TFs in the promoter regions of C1 genes. Heatmap rows indicate cluster 5 TF models, whereas columns represent C1 promoter regions. Heatmap colors show the ratio of binding site matches to the genome-wide average in all promoters (see “Materials and methods”), with red indicating high over-representation. Right-most column shows the family of the respective TF. Similar enrichment analysis for genes in all differentially expressed clusters is shown in Supplemental Figure S8.

