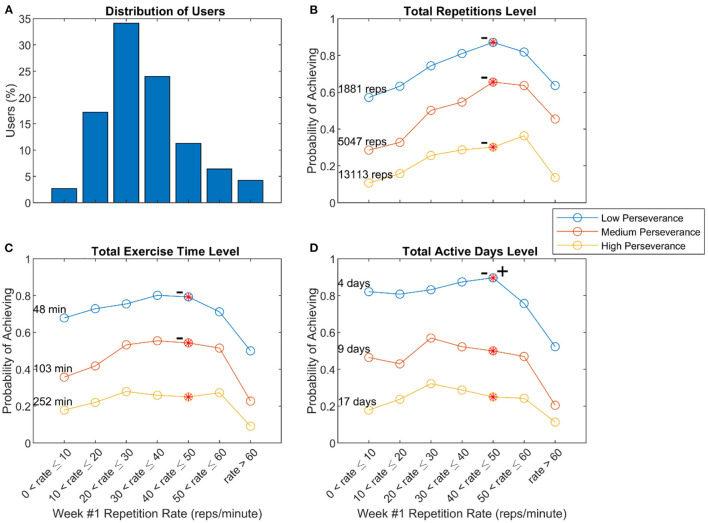
Figure 6.
Relationship of repetition rate of the Reach to Target # 2 exercise in Week 1 and perseverance. (A) Distribution of users with various repetition rates (B–D) Probability of achieving low, medium, and high levels of perseverance, defined to be the 25th, 50th, and 75th percentiles of three measures of usage – total repetitions (B), total exercise time (C), and total active days (D) – measured across 8 weeks of use. The – symbol indicates a significant decline from the peak value moving to the left, and + sign indicates a significant decline from the peak value moving to the right, using the “sweet spot” test described in the methods (p < 0.05).

