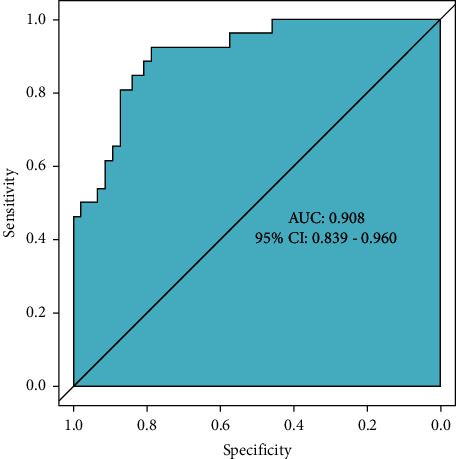
Figure 2.

ROC curve. Note: the value of the area under the ROC curve is between 1.0 and 0.5. In the case of AUC >0.5, the closer the AUC is to 1, the better the diagnostic effect is. AUC has low accuracy when it is 0.5∼0.7, AUC has certain accuracy when it is 0.7∼0.9, and AUC has high accuracy when it is above 0.9. When AUC = 0.5, it means that the diagnostic method does not work at all and has no diagnostic value.
