
Figure 4.
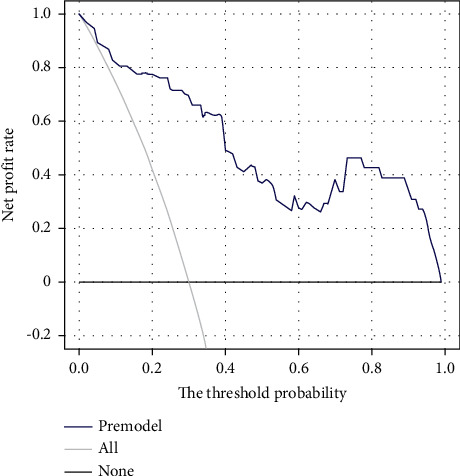
Decision curve. Note: the profit rate of the model within the threshold probability range is higher than the “all” curve (assuming all neonates with ABE and all interventions) and the “none” curve (assuming all neonates do not have ABE and no intervention).