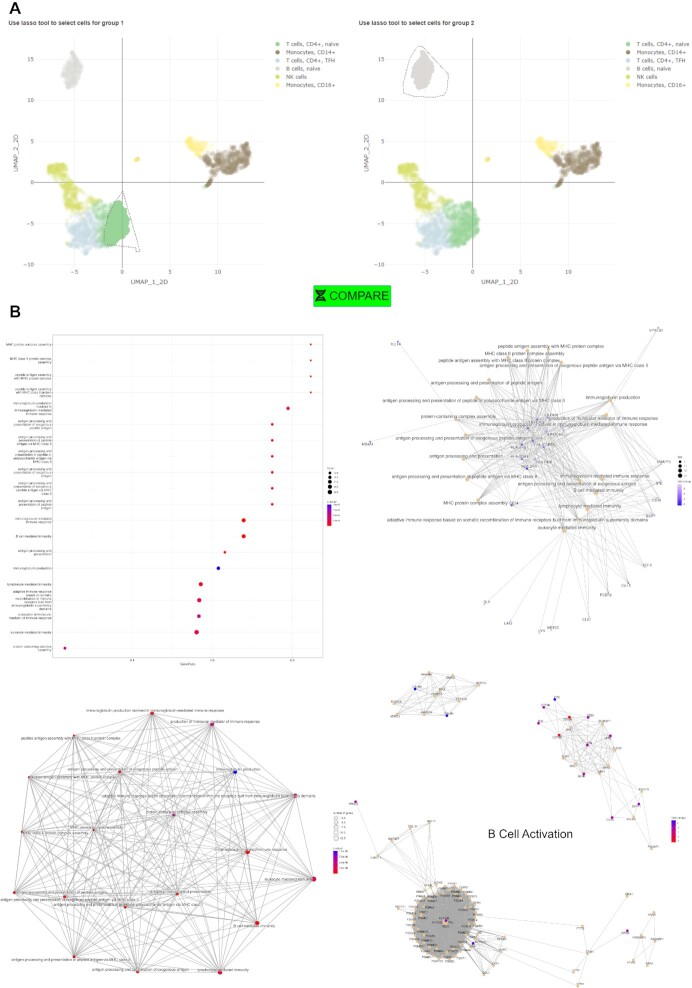
Figure 3.
User selected differential expression analyses and gene set enrichment. (A) ICARUS provides the user the option to interactively select customised cell groups using a lasso select function for differential expression tests. (B) Extended visualizations of enriched terms (gene set enrichment analysis) including a dot plot ordered by gene ratio, a gene concept network showcasing genes involved with enriched terms and an enrichment map consisting of a network of enriched terms with edges connecting overlapping gene sets. Enriched terms may also be visualised individually as gene pathways (B cell activation pathway shown in figure).

