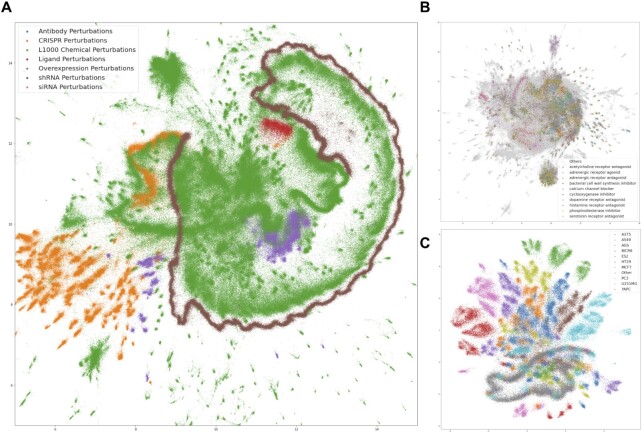
Figure 2.
Global View of L1000 Signatures (A) L1000 signatures are visualized on a 2D space using UMAP with each signature colored by its perturbation type. (B) UMAP plot of the chemical perturbagen signatures colored by the mode of action of the small molecules. (C) UMAP of CRISPR KO signatures colored by cell line.

