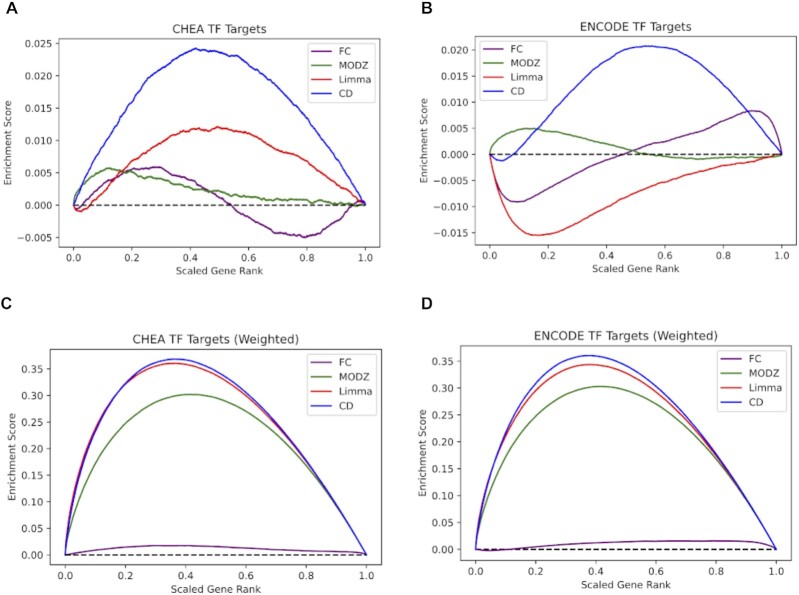
Figure 3.
L1000 benchmarking. Random walk visualizations of the recovery of transcription factor (TF) target genes for L1000 CRISPR knockdown signatures targeting 44 TFs. The signatures are computed with four different differential expression analysis methods: fold change (FC), moderated Z-score (MODZ), limma, and the characteristic direction (CD). (A) Unweighted random walk comparing ranked genes from L1000 differential expression signatures with ChEA3 TF target gene sets. (B) Unweighted random walk comparing differentially expressed genes to ENCODE TF target gene sets. (C) Weighted walk comparing differentially expressed genes to ChEA3 target gene sets. Weighted increments were determined by the absolute value of the expression value for each gene, normalized to a scale of (0,1). (D) Weighted walk comparing differentially expressed genes to ENCODE target gene sets.

