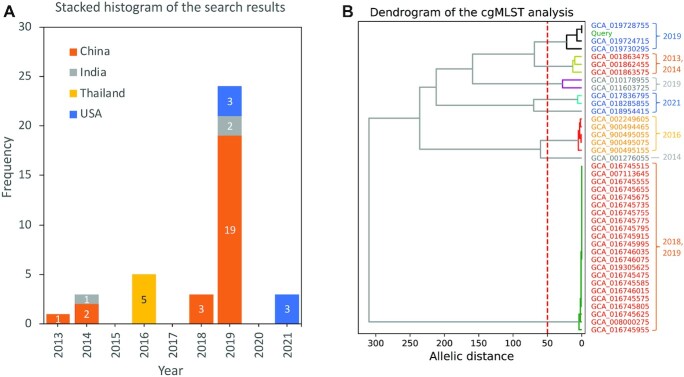
Figure 3.
Analysis of the results of antimicrobial resistance profile search. (A) Stacked histogram of the frequency distribution of years partitioned by country. (B) Dendrogram constructed using cgMLST profiles for the query and 39 hits for Acinetobacter baumannii isolates. Leaf colors indicate the geographical location, which is consistent with the legend of (A). The numbers in the right panel indicate collection years.

